Chapter 7 Reporting and Interpretation
7.1 Introduction
Scores from summative assessments provide information about student achievement with regard to college and career readiness. As noted in chapters on test design and scoring, summative tests provide an overall test score and a set of subscores and performance classifications corresponding to claims within the two content domains (ELA/literacy and mathematics). Members may customize reports based on these scores and subscores for their own use.
This chapter provides an overview of the reporting system. For detailed information, consult the Smarter Balanced User Guide and Interpretive Guide (Smarter Balanced, 2021c, 2021a). Since use of the Smarter Balanced reporting system is optional and configurable, information about a specific member’s reports should be gathered from member websites and materials. Smarter Balanced reports are based on information provided in the output of the test scoring algorithm. Overall scores and subscores each have an associated standard error of measurement (SEM) that indicates the reliability of the score. (For the definition of SEM, please refer to Chapter 2.)
7.2 Overall Test Scores
The method of combining item scores to produce test scores and subscores is presented in detail in the Smarter Balanced Scoring Specification document (Smarter Balanced, 2022c). Scores are calculated using maximum likelihood estimation (MLE) applied at the overall and subscore levels. No special weights for claims, item types, or performance tasks are applied. Desired domain representation is achieved by the numbers of items and points specified in the blueprints.
Overall test scores and subscores (scores based on claims) fall on a vertical scale that spans grades. Vertical scale scores range from a low of approximately 2000 to a high of approximately 3000. Growth in a student’s achievement over time can be measured directly by the difference between the student’s scores from one time (e.g., grade) to another. (Additional information, such as the student’s initial score and how much growth other students with the same initial score tend to exhibit, is needed to understand and evaluate a student’s growth.) The average scale score for a group of students can be used to describe the group’s achievement.
The Smarter Balanced reporting system communicates an overall scale score in relation to achievement levels using graphics similar to Figure 7.1. The student’s overall scale score in this figure is 2635. The color coding in the figure shows that this score falls into achievement level 3.
By default, the system uses generic terms for the achievement levels: level 1, level 2, level 3, and level 4. Consortium members may use terms such as “novice, developing, proficient, advanced” or others. The achievement level boundaries illustrated in Figure 7.1 are those for grade 8 mathematics.
Smarter Balanced has developed a set of optional achievement level descriptors (ALDs) for English language arts/literacy (ELA/literacy) and mathematics. The descriptors are aligned with the Common Core State Standards (CCSS) and Smarter Balanced assessment claims. These descriptors intend to specify, in content terms, the knowledge and skills that students may display at four levels of achievement. The full set of optional reporting ALDs are shown in Appendix C.
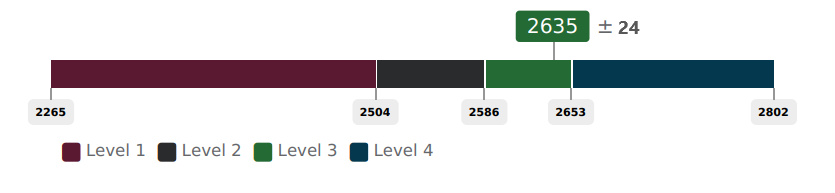
Figure 7.1: Portrayal of Score Reporting Levels and Error Band
7.3 Standard Error
Reporting and explaining the standard error of a test score in reports is an important measurement principle. Smarter Balanced routinely reports the standard errors of test scores, as exemplified by “± 24” in Figure 7.1. The standard error of the student’s test score in this figure is 24.
Understanding the standard error requires imagining the student has taken a different test, but one that is equivalent in every respect to the test the student actually took. There is an approximately two-thirds chance that the student’s score on that test would fall within a range that extends from one standard error below to one standard error above the student’s reported scale score. For the test score illustrated in Figure 7.1, this range extends from 2611-2659.
Another interpretation of the standard error involves the concept of a student’s true score. Imagine a distribution of scores from a large number of equivalent tests that the student could have taken. The student’s test score is the score from the test the student actually took. It is just one of the scores in the hypothetical distribution of possible scores the student could have received. This is called the student’s “observed score” to distinguish it from the hypothetical “true score.” The true score is the average score from the hypothetical distribution of possible observed scores. Importantly, the true score is considered the most valid indicator of the student’s achievement—more valid than the observed score. With these concepts in mind, there is an approximately two-thirds chance that the student’s true score lies within one standard error of the student’s reported (observed) score.
The standard error can be used to assess the reliability of the student’s achievement level. A student’s score will fall into an achievement level, but this result should be interpreted with some caution, especially if the score is less than a standard error from the achievement level boundary. In Figure 7.1, the student’s score (2635) is less than one standard error (24 points) from the lower boundary of level 4 (2653). This means that if the student were to have taken a different, but equivalent test, there is a fair chance the student’s score on that test would fall into level 4. Alternatively, although the student’s true score is most likely in level 3, there is a fair chance that it lies in level 4.
7.4 Subscores
For the full blueprint exams, subscores are reported for student performance on important domains within each content area. In most cases, a subscore corresponds to a single claim. In mathematics, however, claims 2 and 4 are so intertwined that they are reported as a single subscore. The claims are the primary structural elements in the test blueprints and item development guidelines. The claims on which subscores are based are described below.
7.4.1 ELA/Literacy Subscores/Claims
Subscore 1/Claim 1: Reading
- Students can read closely and analytically to comprehend a range of increasingly complex literary and informational texts.
Subscore 2/Claim 2: Writing
- Students can produce effective and well-grounded writing for a range of purposes and audiences.
Subscore 3/Claim 3: Speaking and Listening
- Students can employ effective speaking and listening skills for a range of purposes and audiences. At this time, only listening is assessed.
Subscore 4/Claim 4: Research/Inquiry
- Students can engage in research/inquiry to investigate topics and to analyze, integrate, and present information.
7.4.2 Mathematics Subscores/Claims
Subscore 1/Claim 1: Concepts and Procedures
- Students can explain and apply mathematical concepts and interpret and carry out mathematics procedures with precision and fluency.
Subscore 2/Claims 2 and 4
- Claim 2: Problem-solving. Students can solve a range of complex, well-posed problems in pure and applied mathematics, making productive use of knowledge and problem-solving strategies. Students can analyze complex, real-world scenarios and can construct and use mathematical models to interpret and solve problems.
- Claim 4: Modeling and data analysis. Students can analyze complex, real-world scenarios and can construct and use mathematical models to interpret and solve problems.
Subscore 3/Claim 3: Communicating Reasoning
- Students can clearly and precisely construct viable arguments to support their own reasoning and to critique the reasoning of others.
7.4.3 Performance Classifications
Due to the larger measurement error of subscores, student performance on claims is not reported in the same way as overall scores. The measurement error of subscores is relatively large because fewer items are used to measure student proficiency on the claims compared to the total number of items in the test. That is, the measurement error of student proficiency on claims is larger than the measurement error of overall student performance. Details and illustrations of the measurement error of claim scores relative to the measurement error of the overall scores are presented in Chapter 5.
Rather than reporting subscores as observed scale scores with standard errors, student performance on the content on which subscore is based is classified by whether the student’s performance is “below standard,” “near standard,” or “above standard.” These designations are based on how far the subscore is from the standard, in terms of its SEM, with the lower boundary of level 3 (the level 3 cut score) being the standard. The level 3 cut score is used as the standard because it represents being on track for college and career readiness according to a criterion-referenced standard setting process.
The criteria for each of the three performance classifications, with respect to the college and career readiness standard, are:
- Above Standard: The subscore is at or above the level 3 cut score by more than 1.5 of its SEM.
- Near Standard: The subscore does not meet the definition for above or below standard.
- Below Standard: The subscore is below the level 3 cut score by more than 1.5 of its SEM.
Figure 7.2 illustrates one way to understand performance classifications. The topmost band in this figure represents achievement level boundaries on the vertical scale used to report the overall scale score. Below this are two bands for each of the two hypothetical claims, claim X and claim Y, the correspondence between “most likely” performance classifications and achievement levels. For both claims X and Y, the “at/near” classification is centered on the level 3 cut score (the standard). This will be true for all claims. Students who score very close to the level 3 cut score will certainly be classified as “near standard.”
As the student’s subscore gets further away from the standard, however, the student is more likely to be classified as “above standard” or “below standard.” The distance from the level 3 cut score at which an “above” or “below” classification becomes more likely than “near” varies from claim to claim as shown in the figure. The distance will be greater for claims whose scores have larger standard errors. The figure indicates that claim Y scores tend to have larger standard error than claim X scores because the “near” classification band extends farther away from the standard for claim Y than for claim X. In general, the larger the standard error, the further a subscore has to be from the level 3 cut score in order to meet the 1.5 standard error criterion for an “above” or “below” classification.
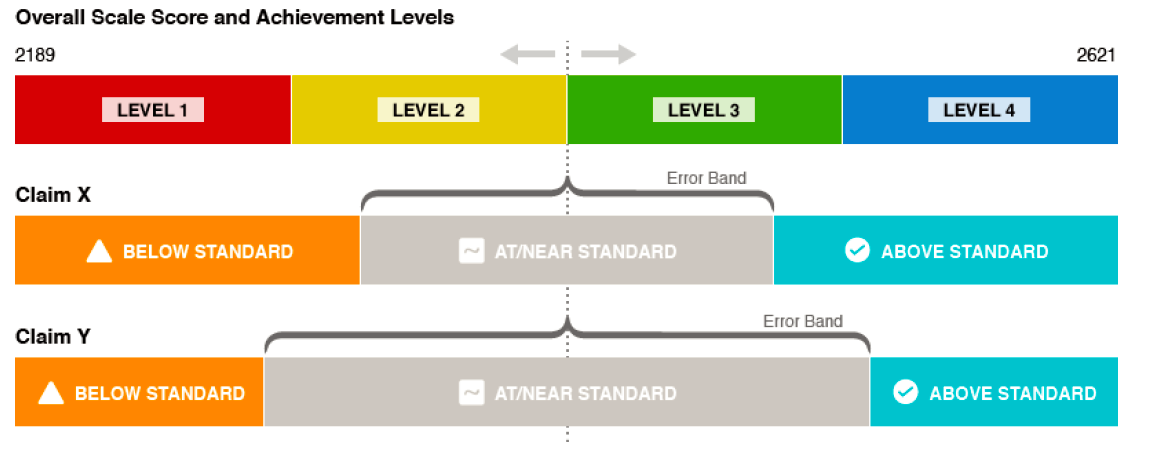
Figure 7.2: Portrayal of Subscore Reporting
It is important to understand that even for the same claim, the performance classification may differ for two students with the same score. This is because the students’ scores may not have the same standard error. In a computer adaptive test (CAT), students receive different items. The standard error size depends not only on how many items were administered (this is typically the same for the two students), but on which specific items were administered (this typically differs between the two students). The plots near the end of Chapter 2 show how much the standard error of claim scores can vary among students receiving the same score. This is why the performance classification bands in Figure 7.2 should be interpreted as “most likely.” At the boundaries (e.g., the boundary between “below” and “near”), two different performance classifications are equally likely.
Although subscores are reported in Smarter Balanced student reports by the three reporting categories, the actual scale scores and SEMs associated with subscores are available to members in the data provided from the test scoring system. Members may use these in local reporting systems.
7.5 Types of Reports
The Smarter Balanced open-source reporting system allows the users to produce both public-facing and secure score reports for both the summative and interim assessments. These online reports comprise the individual student reports and the aggregate reports used by school, district, and state-level users. This component is also used for numerous data extracts, including assessment completions, student results, and individual item responses. All reports are available online. The individual student reports (ISR) include an option for printing or downloading a PDF in either color or gray scale.
The reporting system allows for the creation of optional student groups (e.g., teacher’s classes). This feature allows a user with the group administrator role to create and manage groups for a district or school. Groups are assigned to users who have permission to view individual test results for students in their assigned groups.
In addition, the reporting system allows users to filter by certain criteria as defined by the U.S. Department of Education. Filters include:
- Gender
- Race/ethnicity
- Limited English Proficient (LEP)
- Migrant status
- 504 plan status
- IEP status
There are four basic report types: individual student reports (ISRs), roster reports, item-level reports (interim assessments only), and aggregate reports. The item-level reports are not described in this document because they are available only for interim assessments. The other three types of reports are described in detail below.
In addition to the four predesigned report types, the reporting system offers authorized users the ability to download and export data from each available report for distribution or further review and analysis in external systems.
7.5.1 Individual Student Report (ISR)
This secure report provides the student’s overall scale score and performance level for the selected assessment (summative or interim). For summative assessments and interim comprehensive assessments (ICA), it includes a scale score, a standard error of measurement, achievement level and achievement level descriptor, claim information, writing trait scores (ELA/literacy), and the option to include accommodations available to the student during testing. The ISR for the interim assessment block (IAB) includes a scale score, standard error of measurement, and student performance classification into one of three reporting categories: below standard, near standard, or above standard. The scores and descriptions provide context for understanding what the assessment has measured and how to interpret the scores and subscores. Teachers, students, and parents use this report to understand a student’s achievement and the student’s progress toward mastery of the Common Core State Standards (CCSS). The report may be part of a larger set of information to provide context for instructional focus. In addition to the overall score displays, subscores are reported, as shown in Figure 7.3.
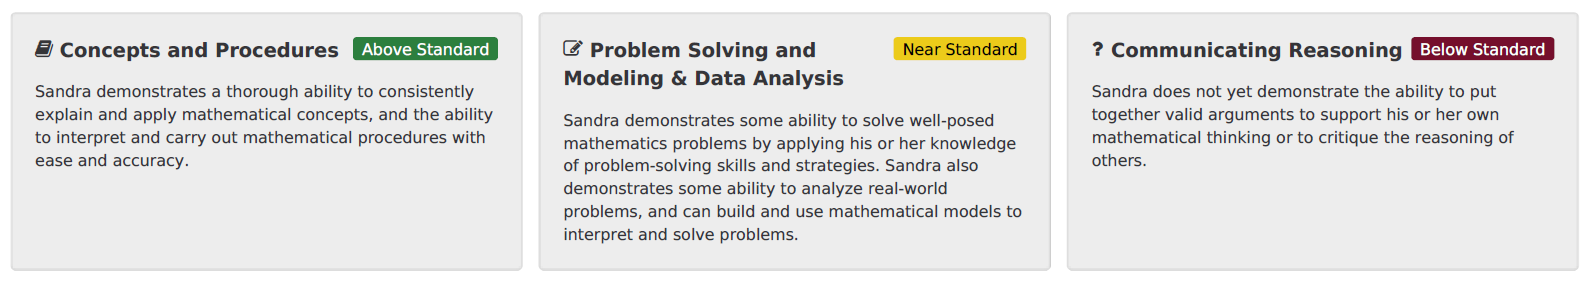
Figure 7.3: Illustration of Subscore Reporting on Individual Student Reports
Individual student reports can be downloaded as PDF files for easy printing and distribution to parents.
7.5.2 Roster Reports
Roster reports are generated for available groups of students. They are most commonly used at the classroom, school, or district level, but may be used for other groupings if they are available to the system. Teachers and administrators commonly use roster reports to identify patterns across groups or to identify students most in need of assistance. Roster reports may be filtered by gender or student demographic data (e.g., LEP, race/ethnicity, IEP, gender, 504, economically disadvantaged, or migrant status) or based on the completeness or validity of student test attempts. Along with other information, roster reports can be used to provide a direction for further investigation about instructional emphasis or to aid in resource allocation.
Figure 7.4 is a screenshot of a roster report that presents the average scale score and error of the mean for the group and displays overall scale scores, error bands, and achievement levels for individual students.
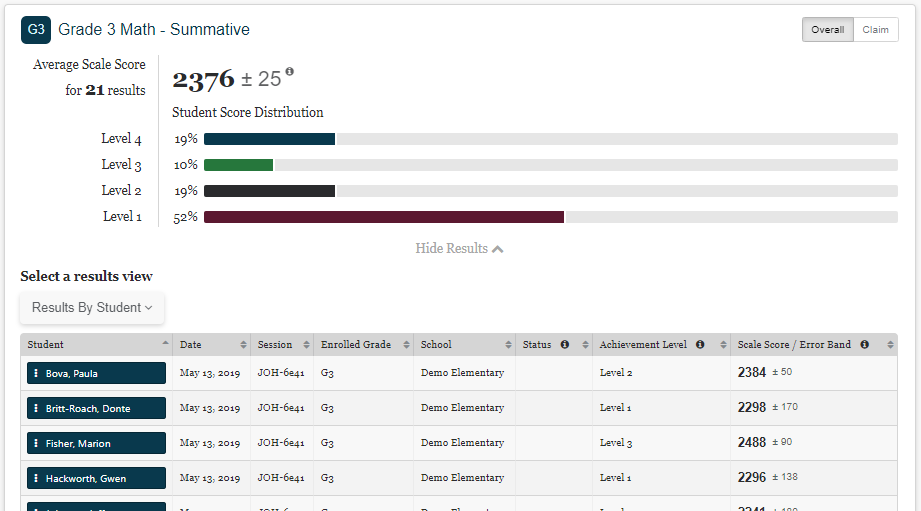
Figure 7.4: Example of a Roster Report of Overall Achievement Levels
Figure 7.5 is a screenshot of a roster report that presents aggregate claim-level data for the group and displays claim reporting categories for individual students.
Note that column headings can be sorted for different purposes. Teachers and administrators may download and export data from each available report for distribution or further review and analysis in external systems.
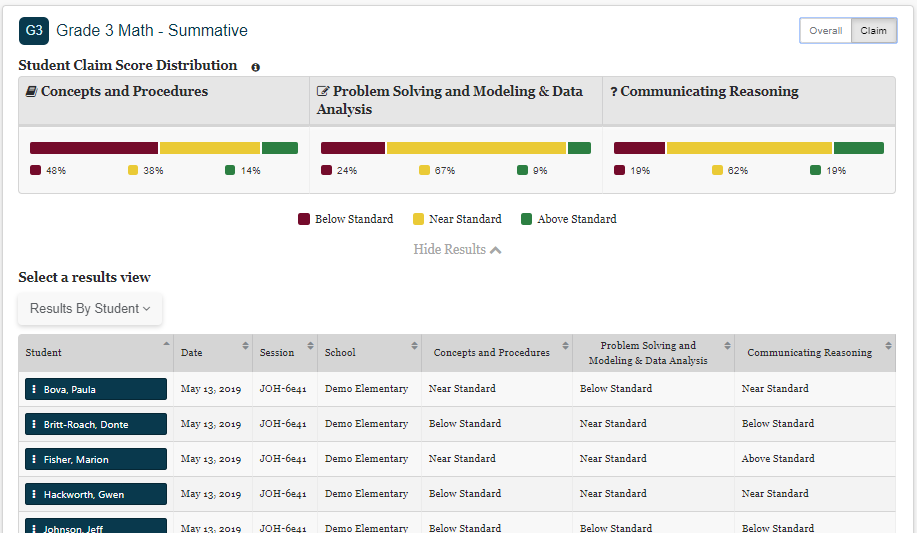
Figure 7.5: Example of a Roster Report of Claim Reporting Categories
7.5.3 Aggregate Reports
The reporting system provides aggregate reports at the group, grade, school, district, and state levels. These reports include:
- Interim Assessment Block (IAB) Dashboard (group level only): This report provides an overview of student performance on all IABs administered to a group of students.
- Student Score Distribution: This report provides the student score distribution by achievement levels for summative and ICAs and by above, near, and below standard reporting categories for IABs.
- Student Claim Score Distribution (summative and ICA): This report provides the distribution of claim scores for a group of students.
- Target Report (summative only): This report provides aggregate target-level data for the ELA/literacy and mathematics summative assessments.
- Key and Distractor Analysis (interim only): This report displays the percentage of students who selected each answer option for multiple-choice and multi-select items.
- Writing Trait Scores: This report displays individual student and group performance on the three writing traits, organization/purpose, evidence/elaboration, and conventions.
- Custom Aggregate Reports: School and district administrators can create customized reports for overall student performance, claim and target performance, and longitudinal reports, including the ability to disaggregate results by student group performance.
District administrators may create custom aggregate reports that provide score data at the state, district, school, and grade level. In the Smarter Balanced reporting system, aggregate reports show how groups are distributed across the four achievement levels. They are typically used to compare among groups or to identify areas of resource need. Like the reports above, aggregate reports can be filtered.
Figure 7.6 shows a mock district-level report with overall district results at the top and school results below. The columns on the right correspond to the achievement levels. Percentages of students in each level are shown.
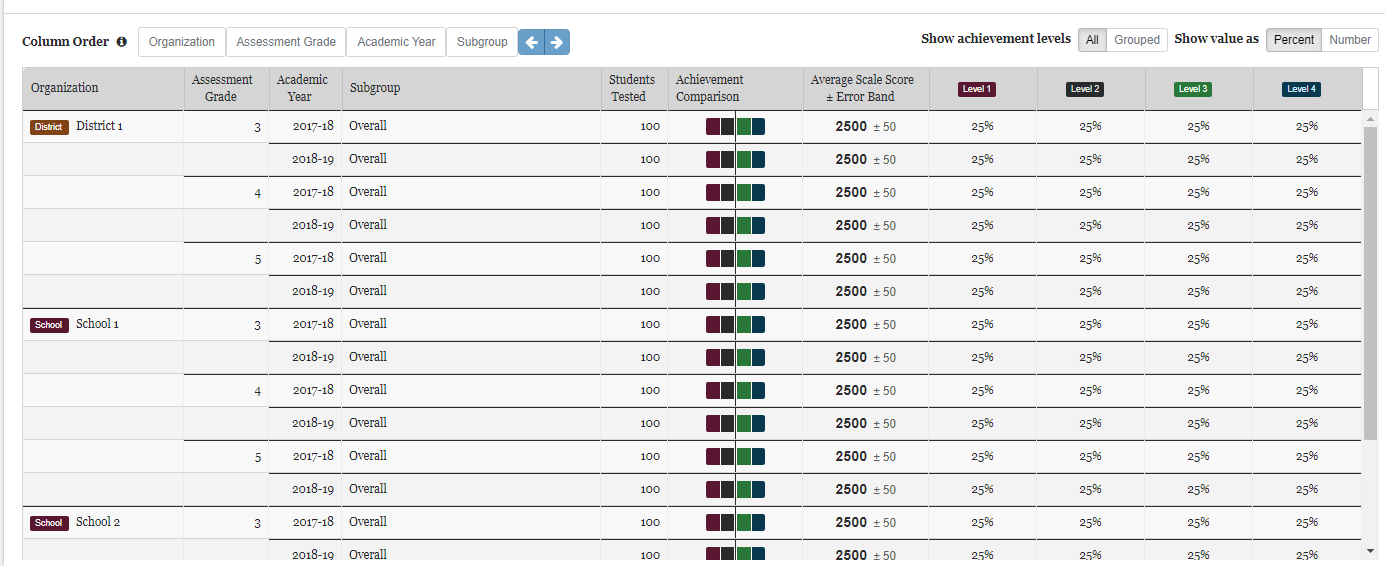
Figure 7.6: Example of an Aggregate Report
7.6 Summary
Smarter Balanced reports tie together achievement levels, reporting achievement level descriptors, and reporting categories (below, near, and above standard) to provide coherent information about student progress. These classifications and descriptions of student achievement are based on test structure, which in turn reflects close analysis of the CCSS. In addition, the Smarter Balanced scale and achievement levels were set by the comprehensive process described and referenced in Chapter 5.
Through the types of reports, the sorting and filtering features of reports, and the customizable features of downloads, Consortium members can obtain a rich set of results suitable for any need. The Smarter Balanced reporting system is designed to be flexible and dynamic.