Chapter 2 Reliability, Precision, and Errors of Measurement
2.1 Introduction
This chapter addresses the technical quality of the interim assessments available in the 2021-22 school year and the functioning of these assessments in terms of expected precision, accuracy, and reliability. Part of the test validity argument is that scores must be consistent and precise enough to be useful for intended purposes. If scores are to be meaningful, tests should deliver the same results for students of the same ability regardless of the specific items each student takes. Interim assessments are fixed forms, but each form is a sample of the same content sampled by the summative assessments, and this allows interim results to be placed on the same scale as summative results. In addition, the range of uncertainty around the score should be small enough to support educational decisions.
Because states do not routinely collect or report item responses on the interim assessments, estimates of precision and reliability are based on statistical attributes of the test items and test forms under the assumption that the interim assessments are administered to groups of students similar to those taking the 2021-22 summative assessment. It is also important to note that although a test’s reliability is sometimes characterized as yielding similar results over hypothetically repeated administrations, in practice, a student’s test performance may improve over repeated administrations due solely to the student becoming more familiar with the test, especially if the same items are used. For interim assessments, it is not possible to give the test more than once to the same student without the experience affecting their performance on the test. For this reason, only first-time test results from interim assessments are comparable among students. The results of repeated administration of the same interim assessment should be interpreted with caution with regard to measuring student growth. Also, interim results are comparable among only those students who are assessed at the same point in time relative to instruction on the knowledge and skill areas represented by the test—usually either just before or just after instruction.
2.2 Precision and Reliability
This section presents the methodology used to compute the precision and reliability of student scale scores on the interim assessments and summarizes results for overall scale scores on the ICAs. The methodology is also relevant to computing scale scores on IABs and FIABs and on reporting categories (claims) of the ICAs, which may be represented in student reports. But student performance on the IABs/FIABs and ICA claims is represented primarily by classifications into performance categories. Section 2.3 explains classifications into performance categories, presents the methodology for computing the accuracy and consistency of such classifications, and presents associated summaries for IABs, FIABs, and ICA claim scores.
A test’s precision is represented by its measurement error, which is called the standard error of measurement (SEM) for an individual student. The SEM for a given student depends on the student’s achievement score. This dependence gives rise to the notation SEM(\(\theta_{i}\)), which means “the SEM for a student whose achievement is represented by the quantity \(\theta_{i}\),” where \(i\) is a number representing the student. The \(\theta\)–scale is an item response theory (IRT) scale and generally ranges from -4 (extremely low achievement) to +4 (extremely high achievement) with a mean of zero. Ultimately, measures of achievement and SEMs on the \(\theta\) scale are transformed to the reporting scale as described in the Smarter Balanced Scoring Specifications (https://technicalreports.smarterbalanced.org/scoring_specs/_book/scoringspecs.html).
The formula for the SEM for student \(i\) whose achievement estimate is \(\hat\theta_{i}\), is:
\[\begin{equation} SEM(\hat{\theta_i}) = \frac{1}{\sqrt{I(\hat{\theta_i})}}, \tag{2.1} \end{equation}\]
where \(I(\theta_{i})\) is the test information for student \(i\), which is based on the items taken by the student and calculated as:
\[\begin{equation} \begin{split} I(\hat{\theta}_{i}) = \sum_{j=1}^{I}D^2a_{j}^2 (\frac{\sum_{l=1}^{m_{j}}l^2Exp(\sum_{k=1}^{l}Da_{j}(\hat{\theta}-b_{jk}))} {1+\sum_{l=1}^{m_{j}}Exp(\sum_{k=1}^{l}Da_{j}(\hat{\theta}-b_{jk}))} - \\ (\frac{\sum_{l=1}^{m_{j}}lExp(\sum_{k=1}^{l}Da_{j}(\hat{\theta}-b_{jk}))} {1+\sum_{l=1}^{m_{j}}Exp(\sum_{k=1}^{l}Da_{j}(\hat{\theta}-b_{jk}))})^2), \end{split} \tag{2.2} \end{equation}\]
where \(m_j\) is the maximum possible score point (starting from 0) for the \(j\)th item, and \(D\) is the scale factor, 1.7. Values of \(a_j\) and \(b_jk\) are item parameters for item \(j\) and score level \(k\).
Figure 2.1 to Figure 2.14 show the \(I(\theta_{i})\) and SEM(\(\theta_{i}\)) for ICAs in each content area and grade, conditional on student proficiency over the range of -4 to +4. The shading in these plots shows the distribution of \(\theta\) in the population of students for each content area and grade. The means \(\mu\) and standard deviations \(\sigma\) of these population \(\theta\) distributions are shown in Table 2.1. The high school (HS) values are used for grades 9, 10, and 11.
| Grade | ELA/Literacy Mean | ELA/Literacy SD | Mathematics Mean | Mathematics SD |
|---|---|---|---|---|
| 3 | -0.908 | 1.030 | -1.067 | 1.115 |
| 4 | -0.437 | 1.074 | -0.557 | 1.162 |
| 5 | -0.085 | 1.133 | -0.177 | 1.226 |
| 6 | 0.123 | 1.207 | 0.048 | 1.306 |
| 7 | 0.362 | 1.285 | 0.307 | 1.391 |
| 8 | 0.534 | 1.363 | 0.494 | 1.475 |
| HS | 0.858 | 1.461 | 0.844 | 1.580 |
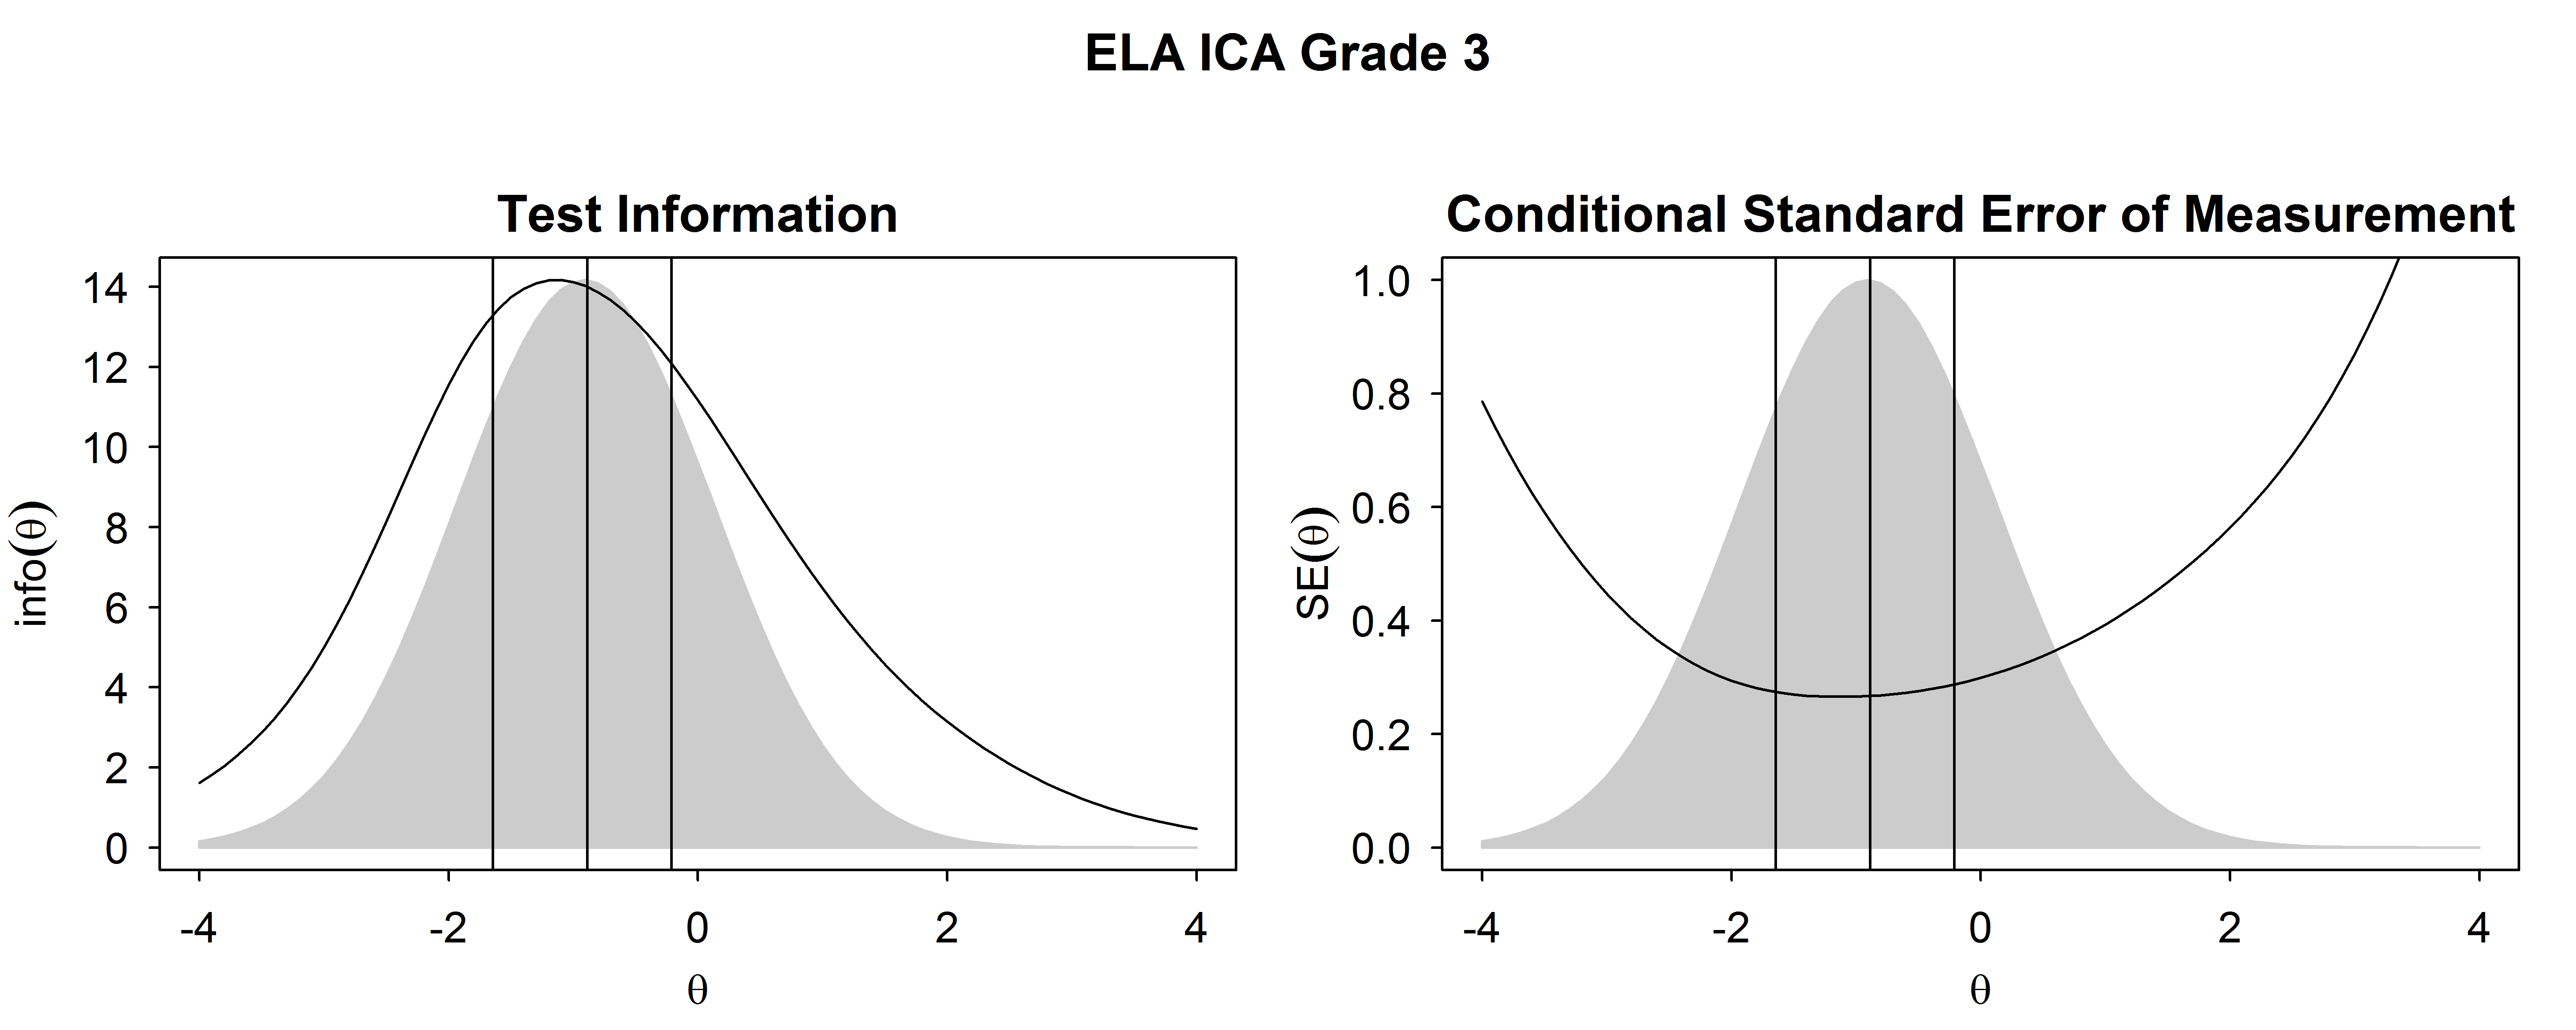
Figure 2.1: Test Information Functions and SEM For ELA/Literacy ICA, Grade 3
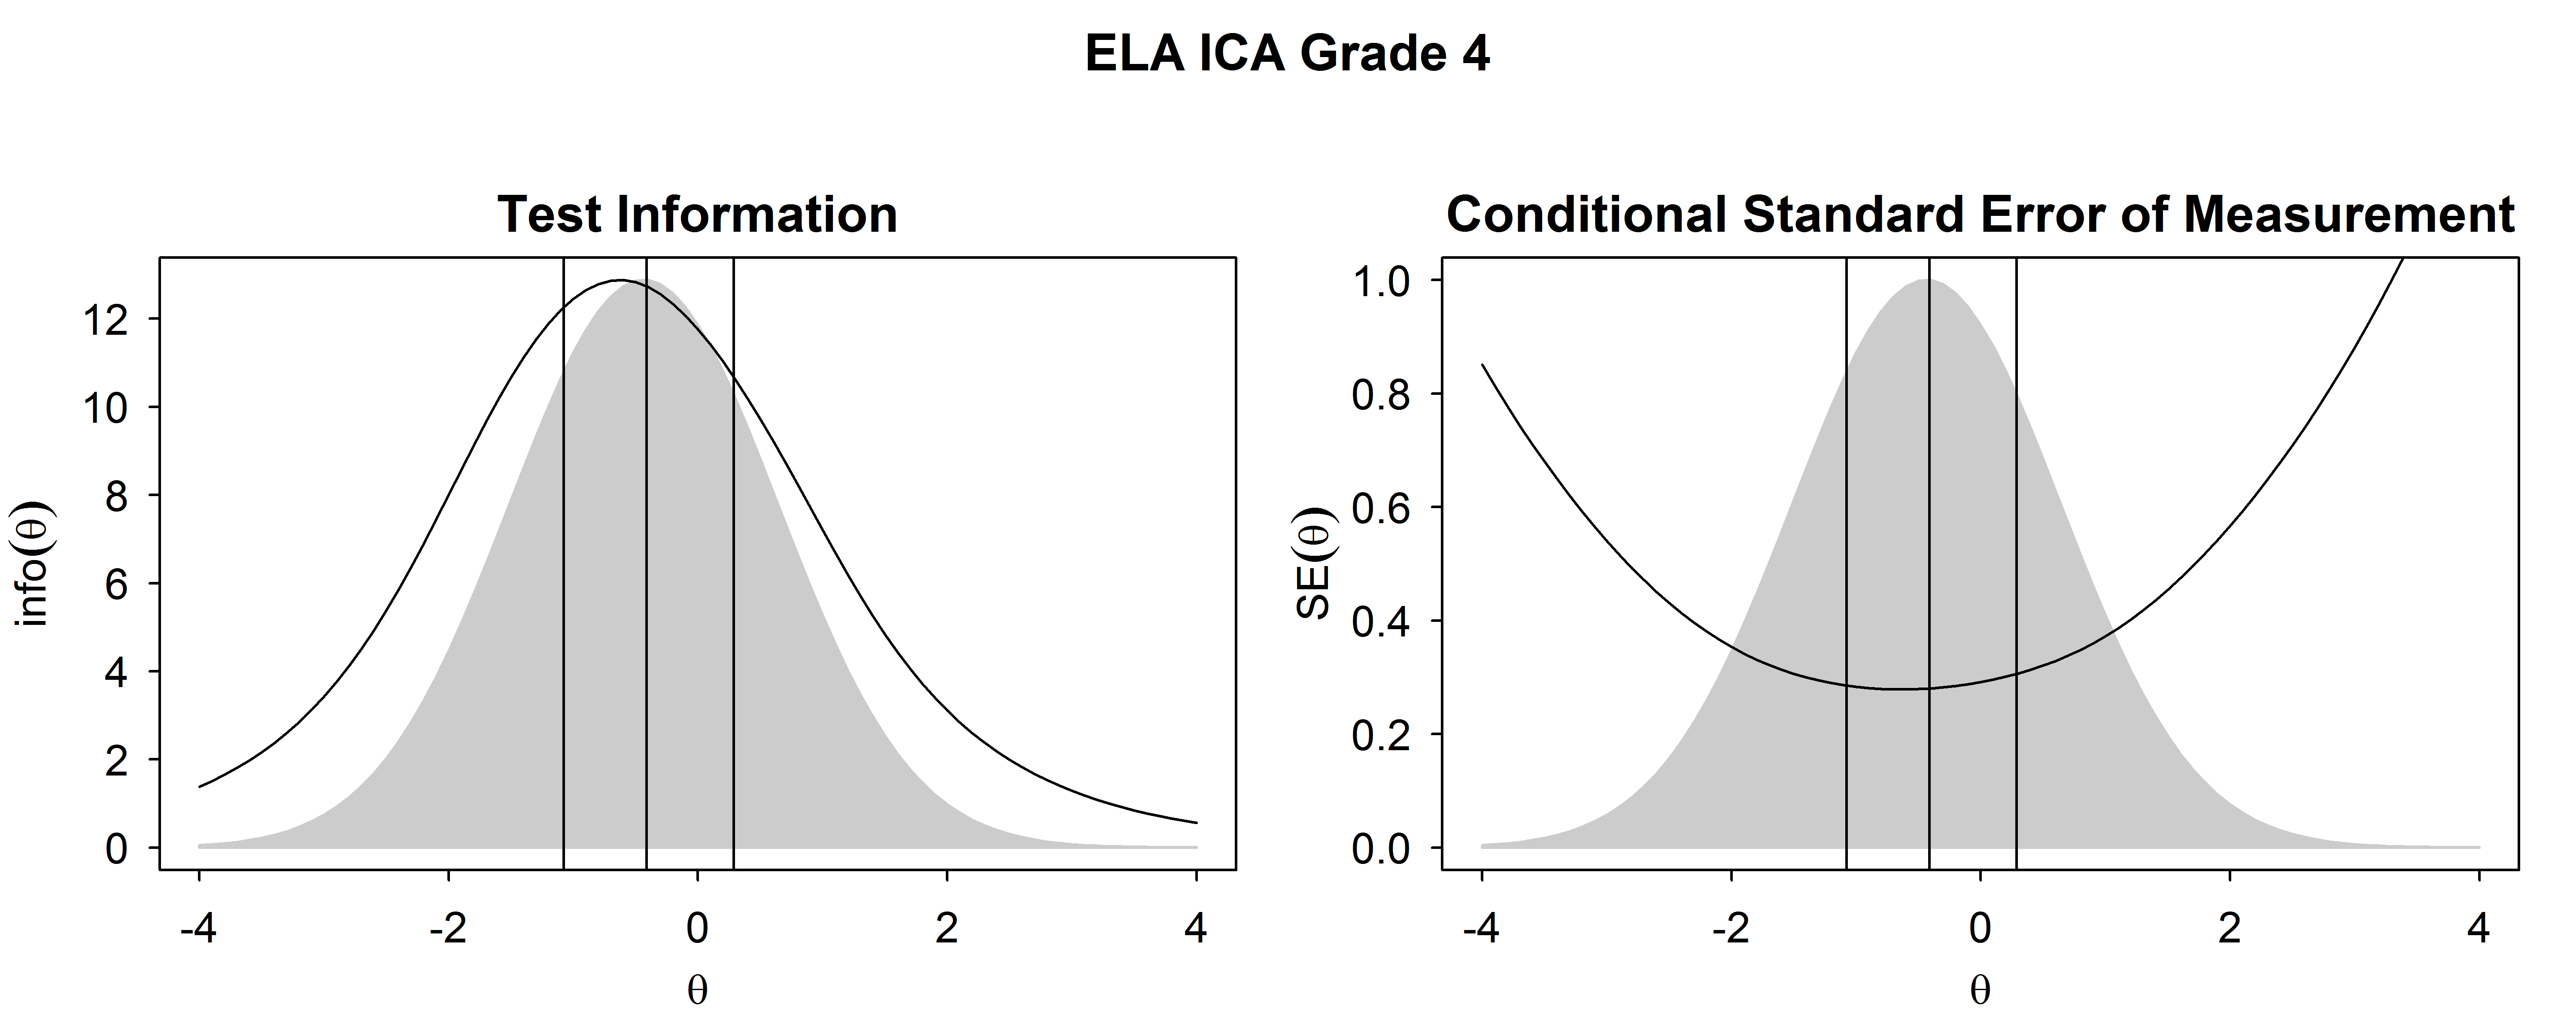
Figure 2.2: Test Information Functions and SEM For ELA/Literacy ICA, Grade 4
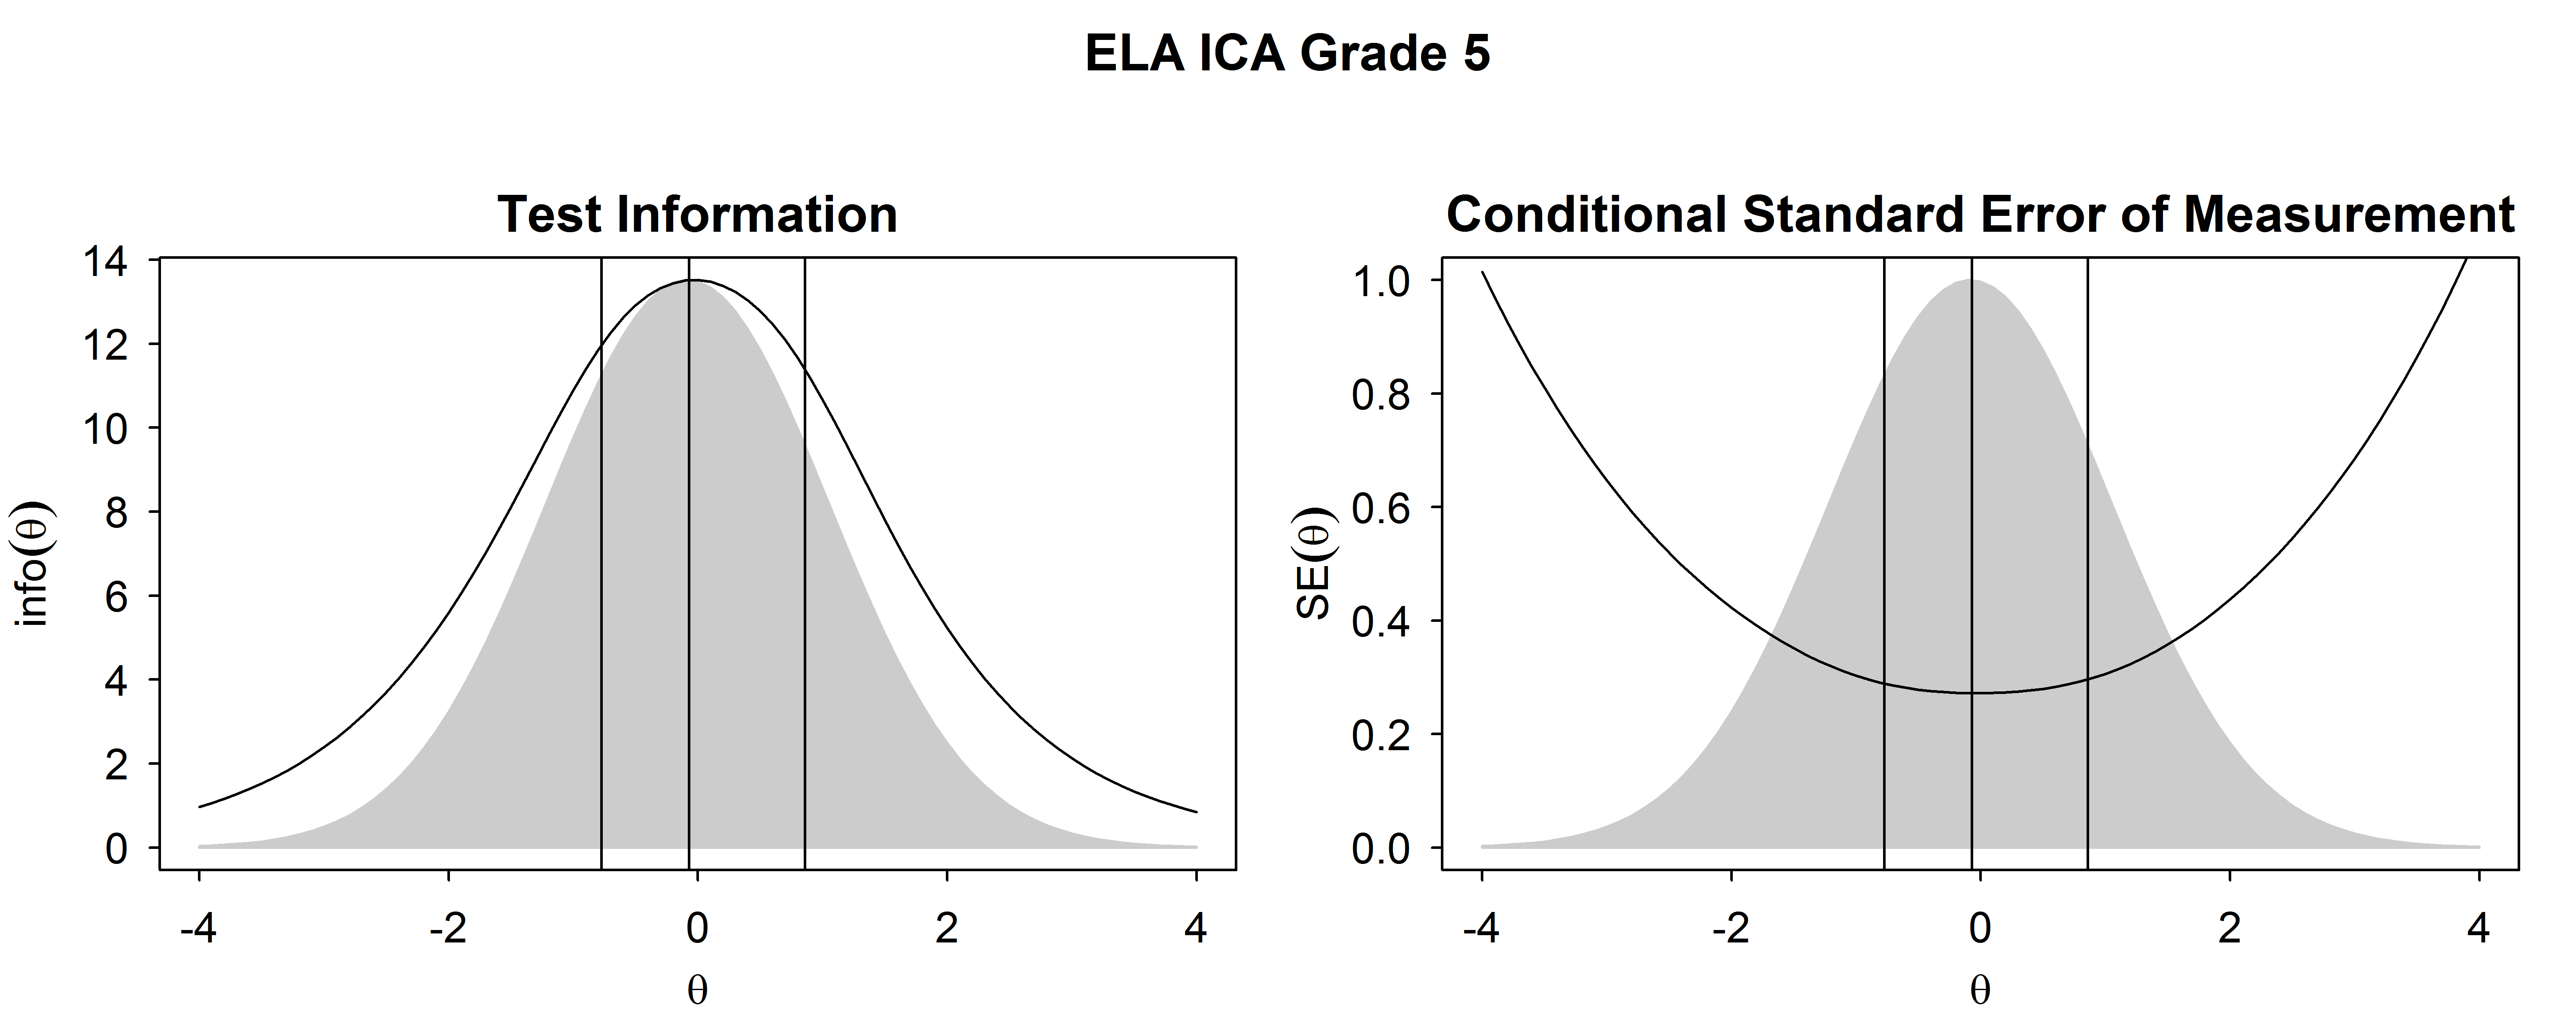
Figure 2.3: Test Information Functions and SEM For ELA/Literacy ICA, Grade 5
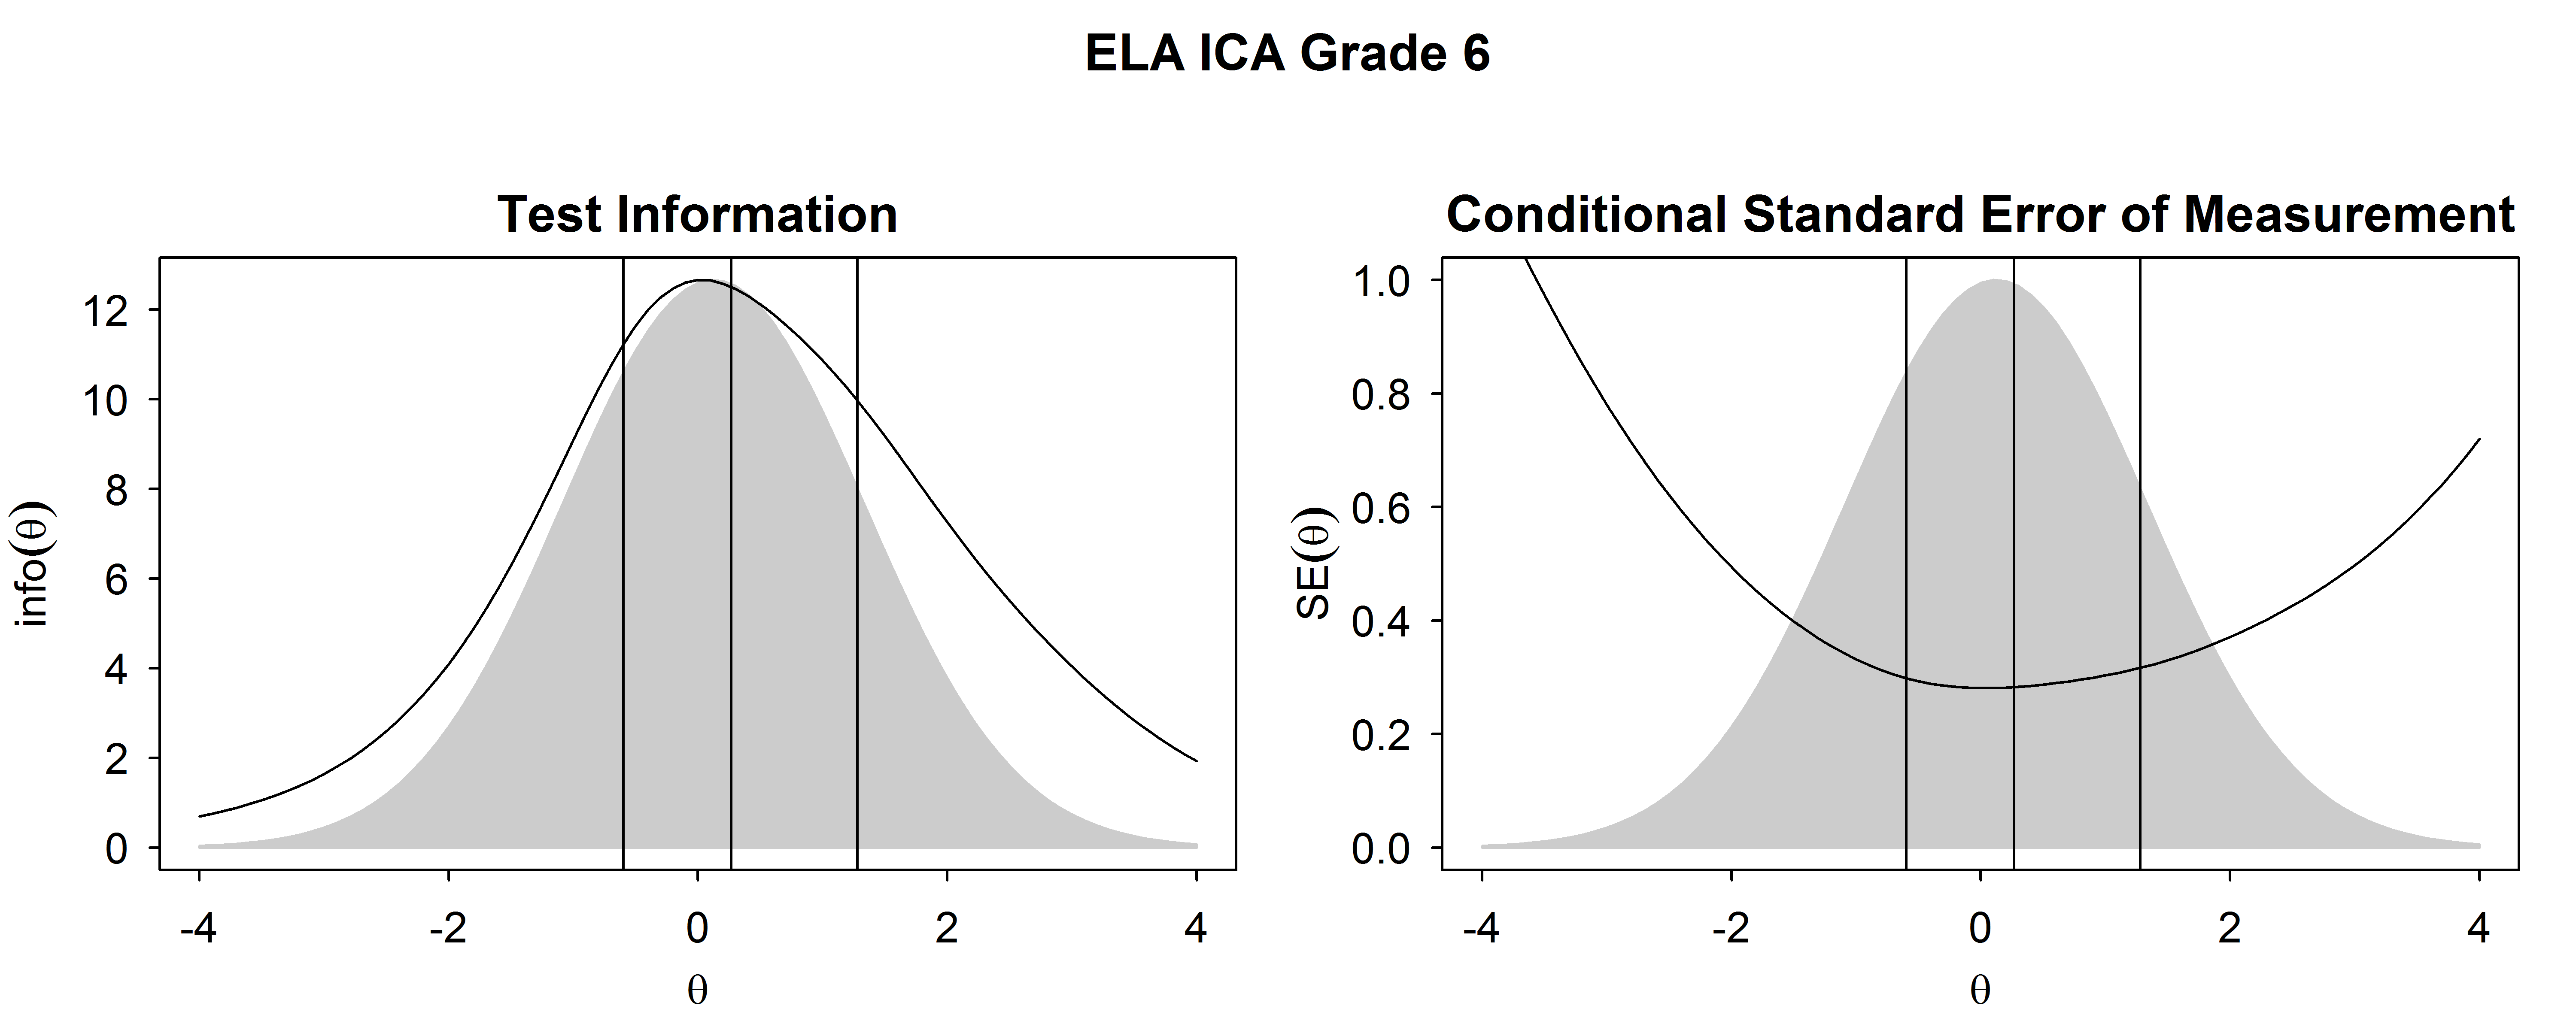
Figure 2.4: Test Information Functions and SEM For ELA/Literacy ICA, Grade 6
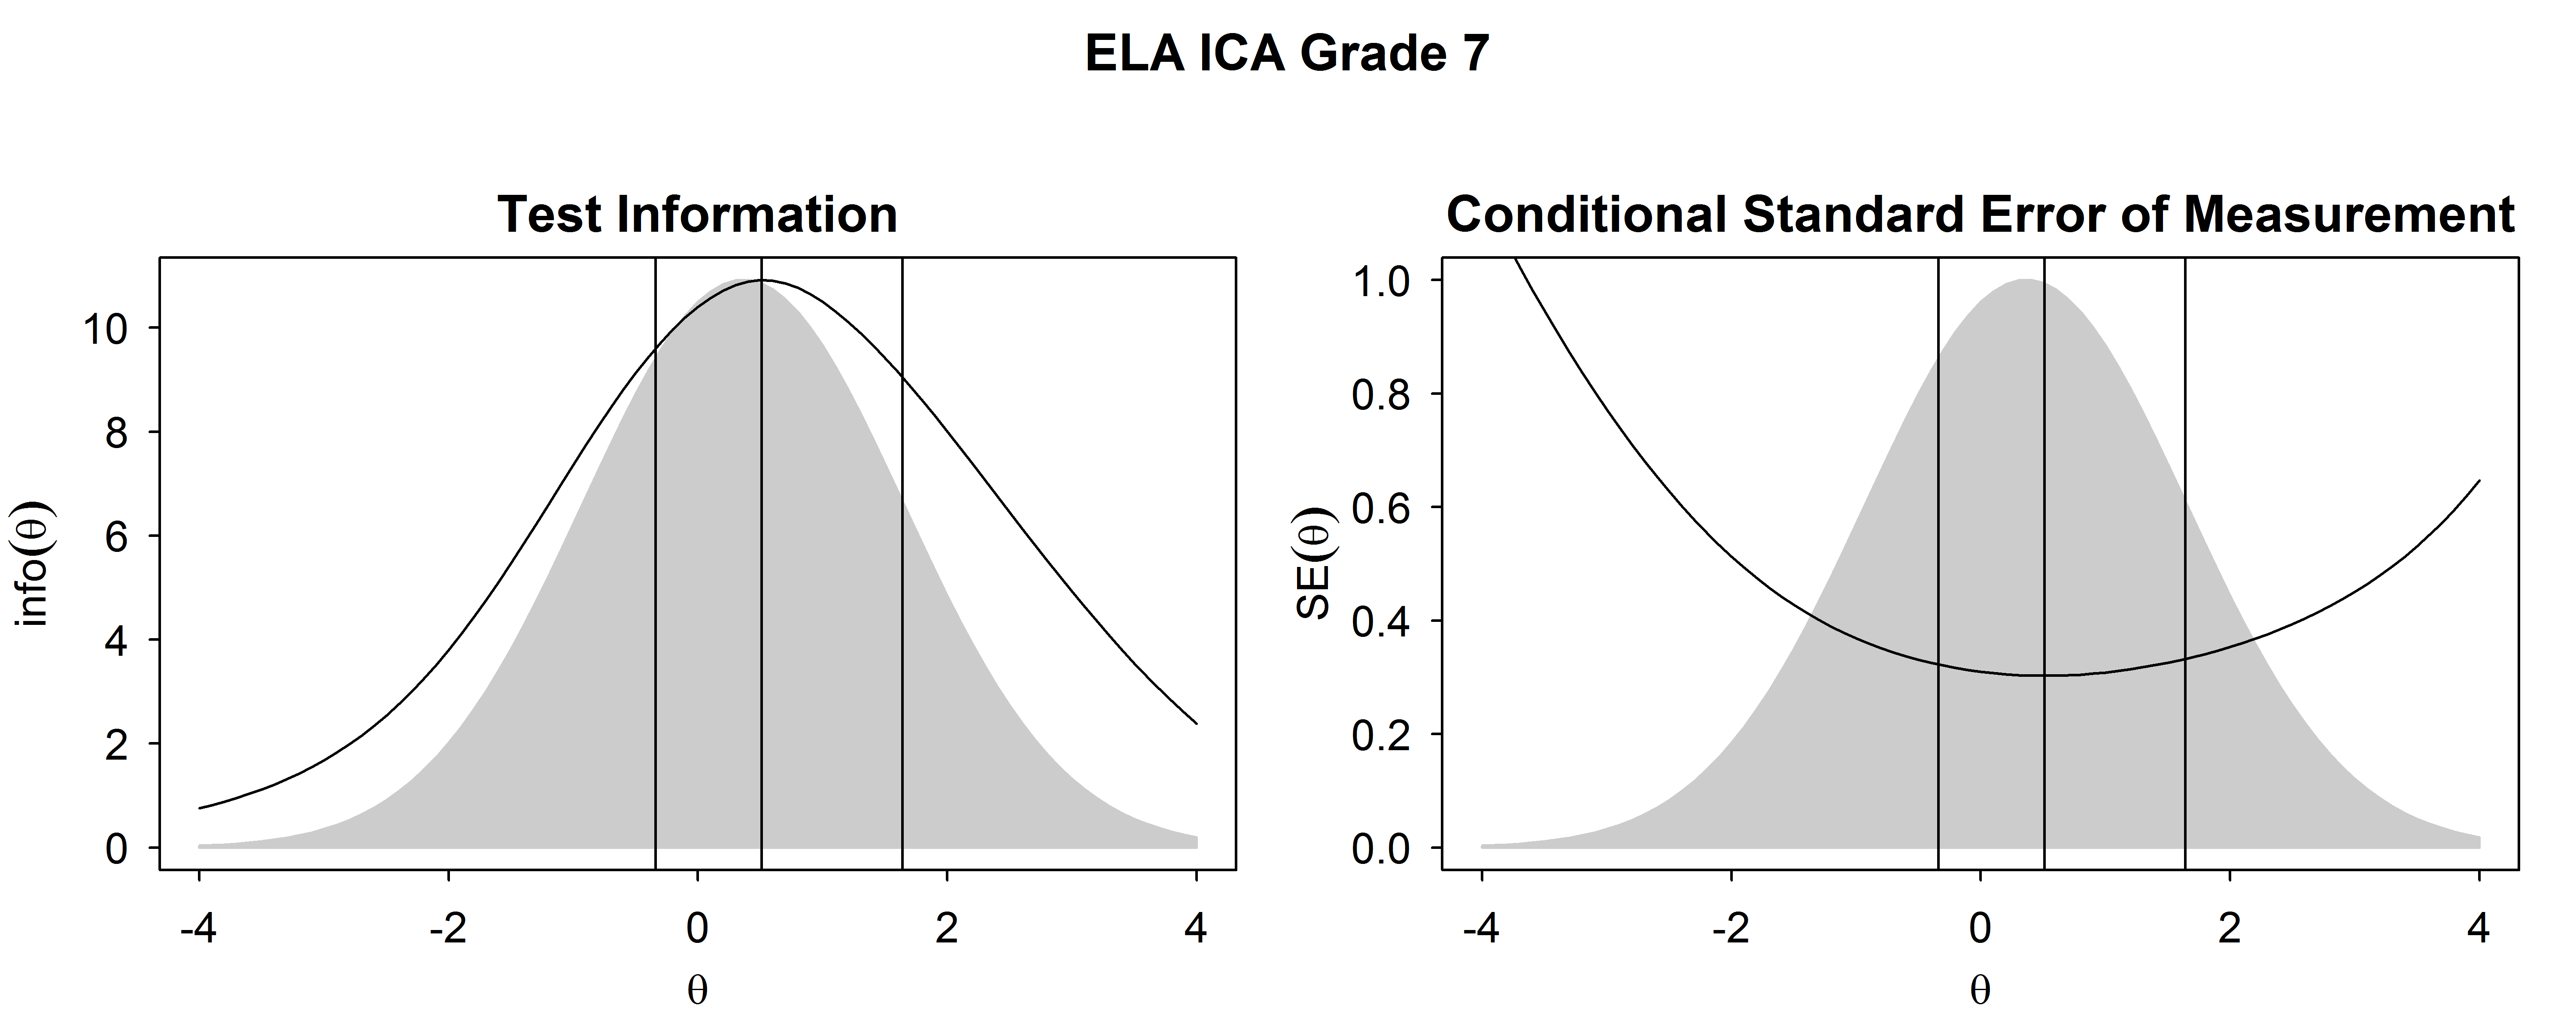
Figure 2.5: Test Information Functions and SEM For ELA/Literacy ICA, Grade 7
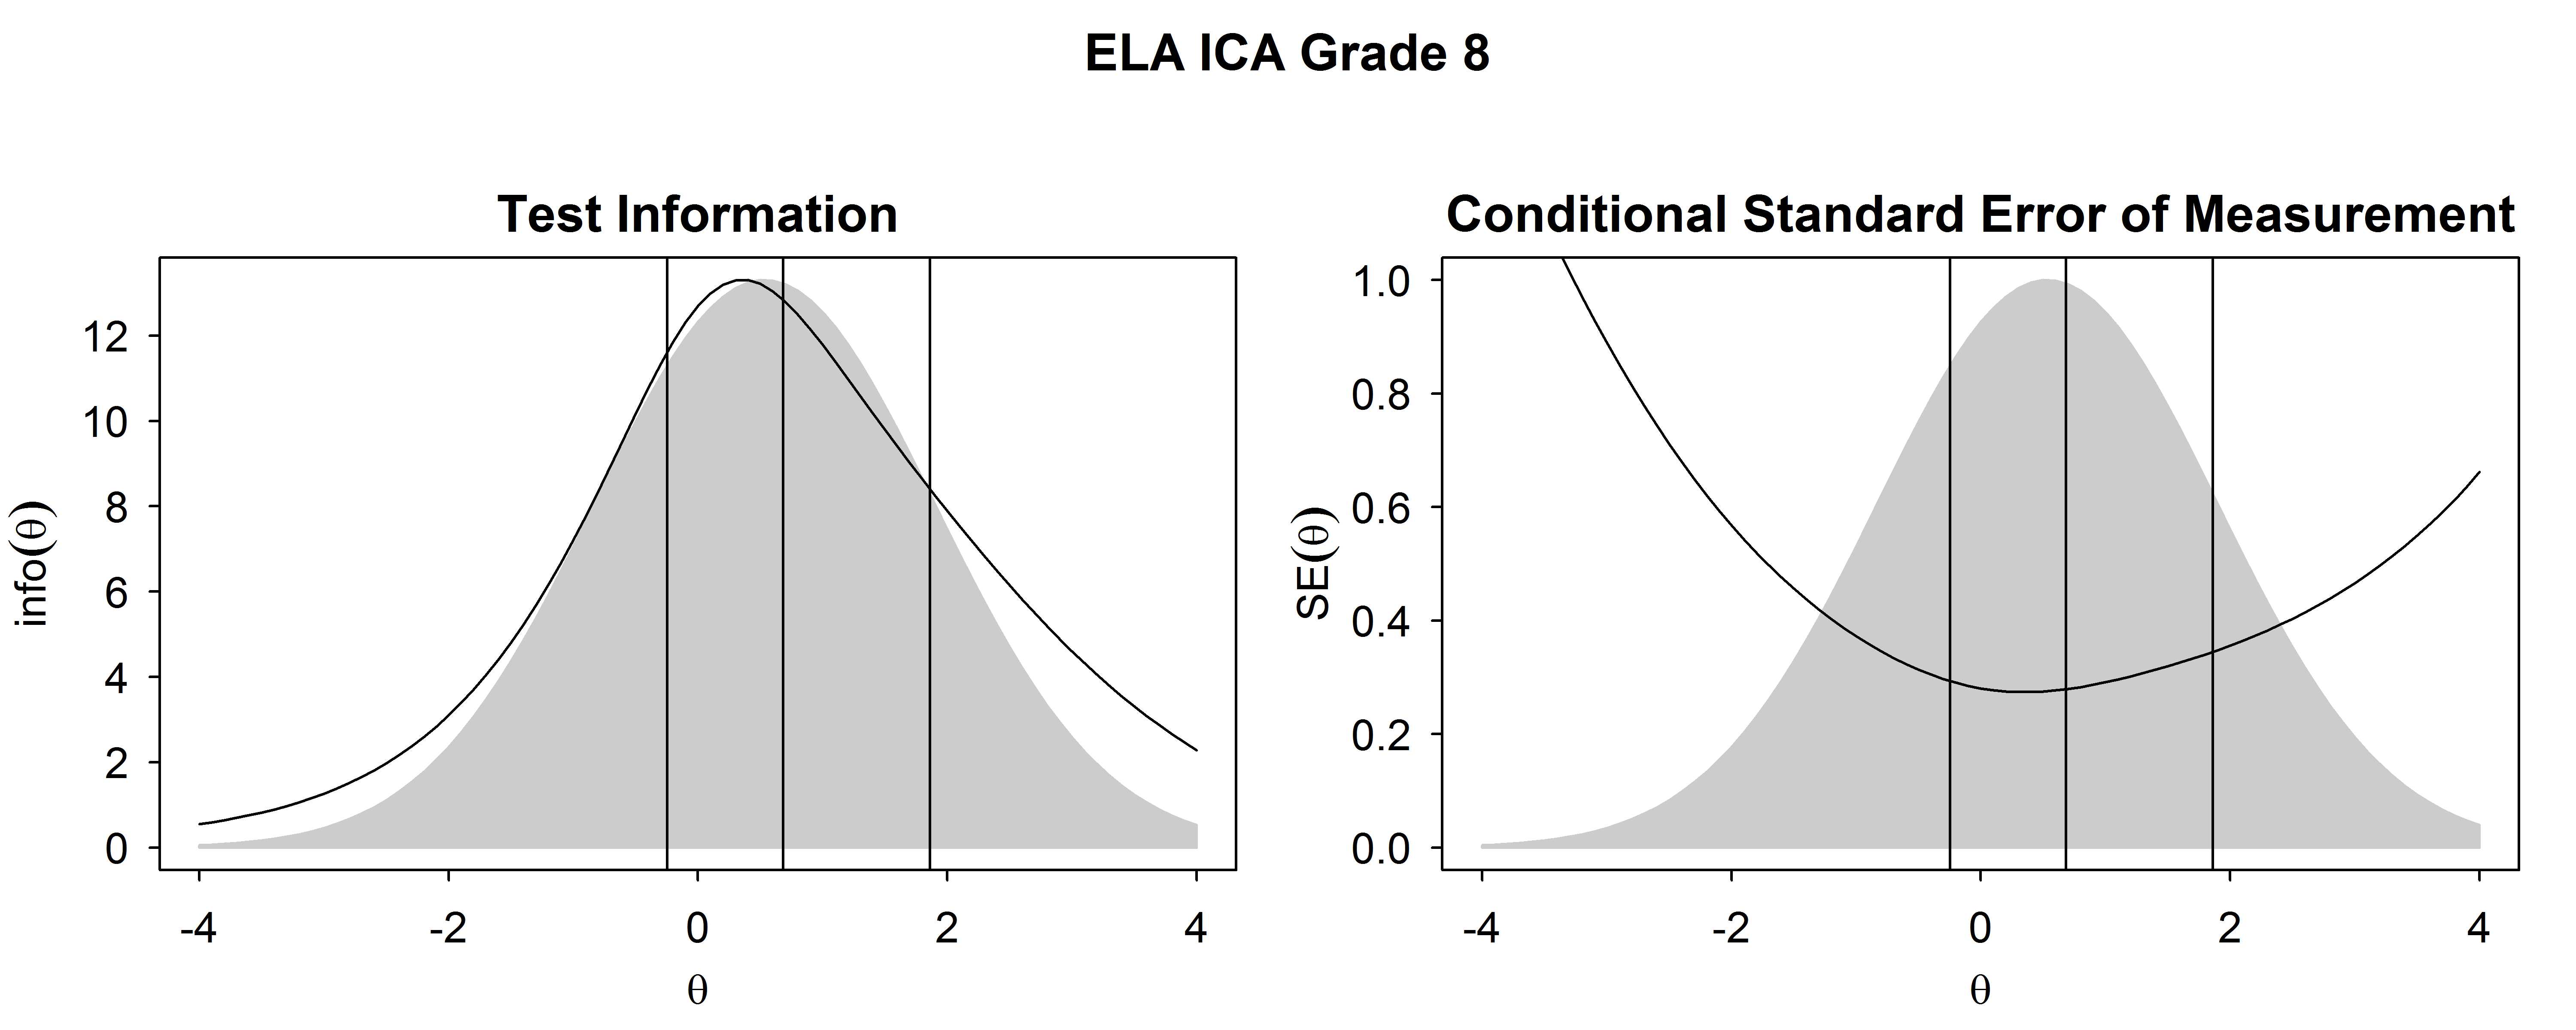
Figure 2.6: Test Information Functions and SEM For ELA/Literacy ICA, Grade 8
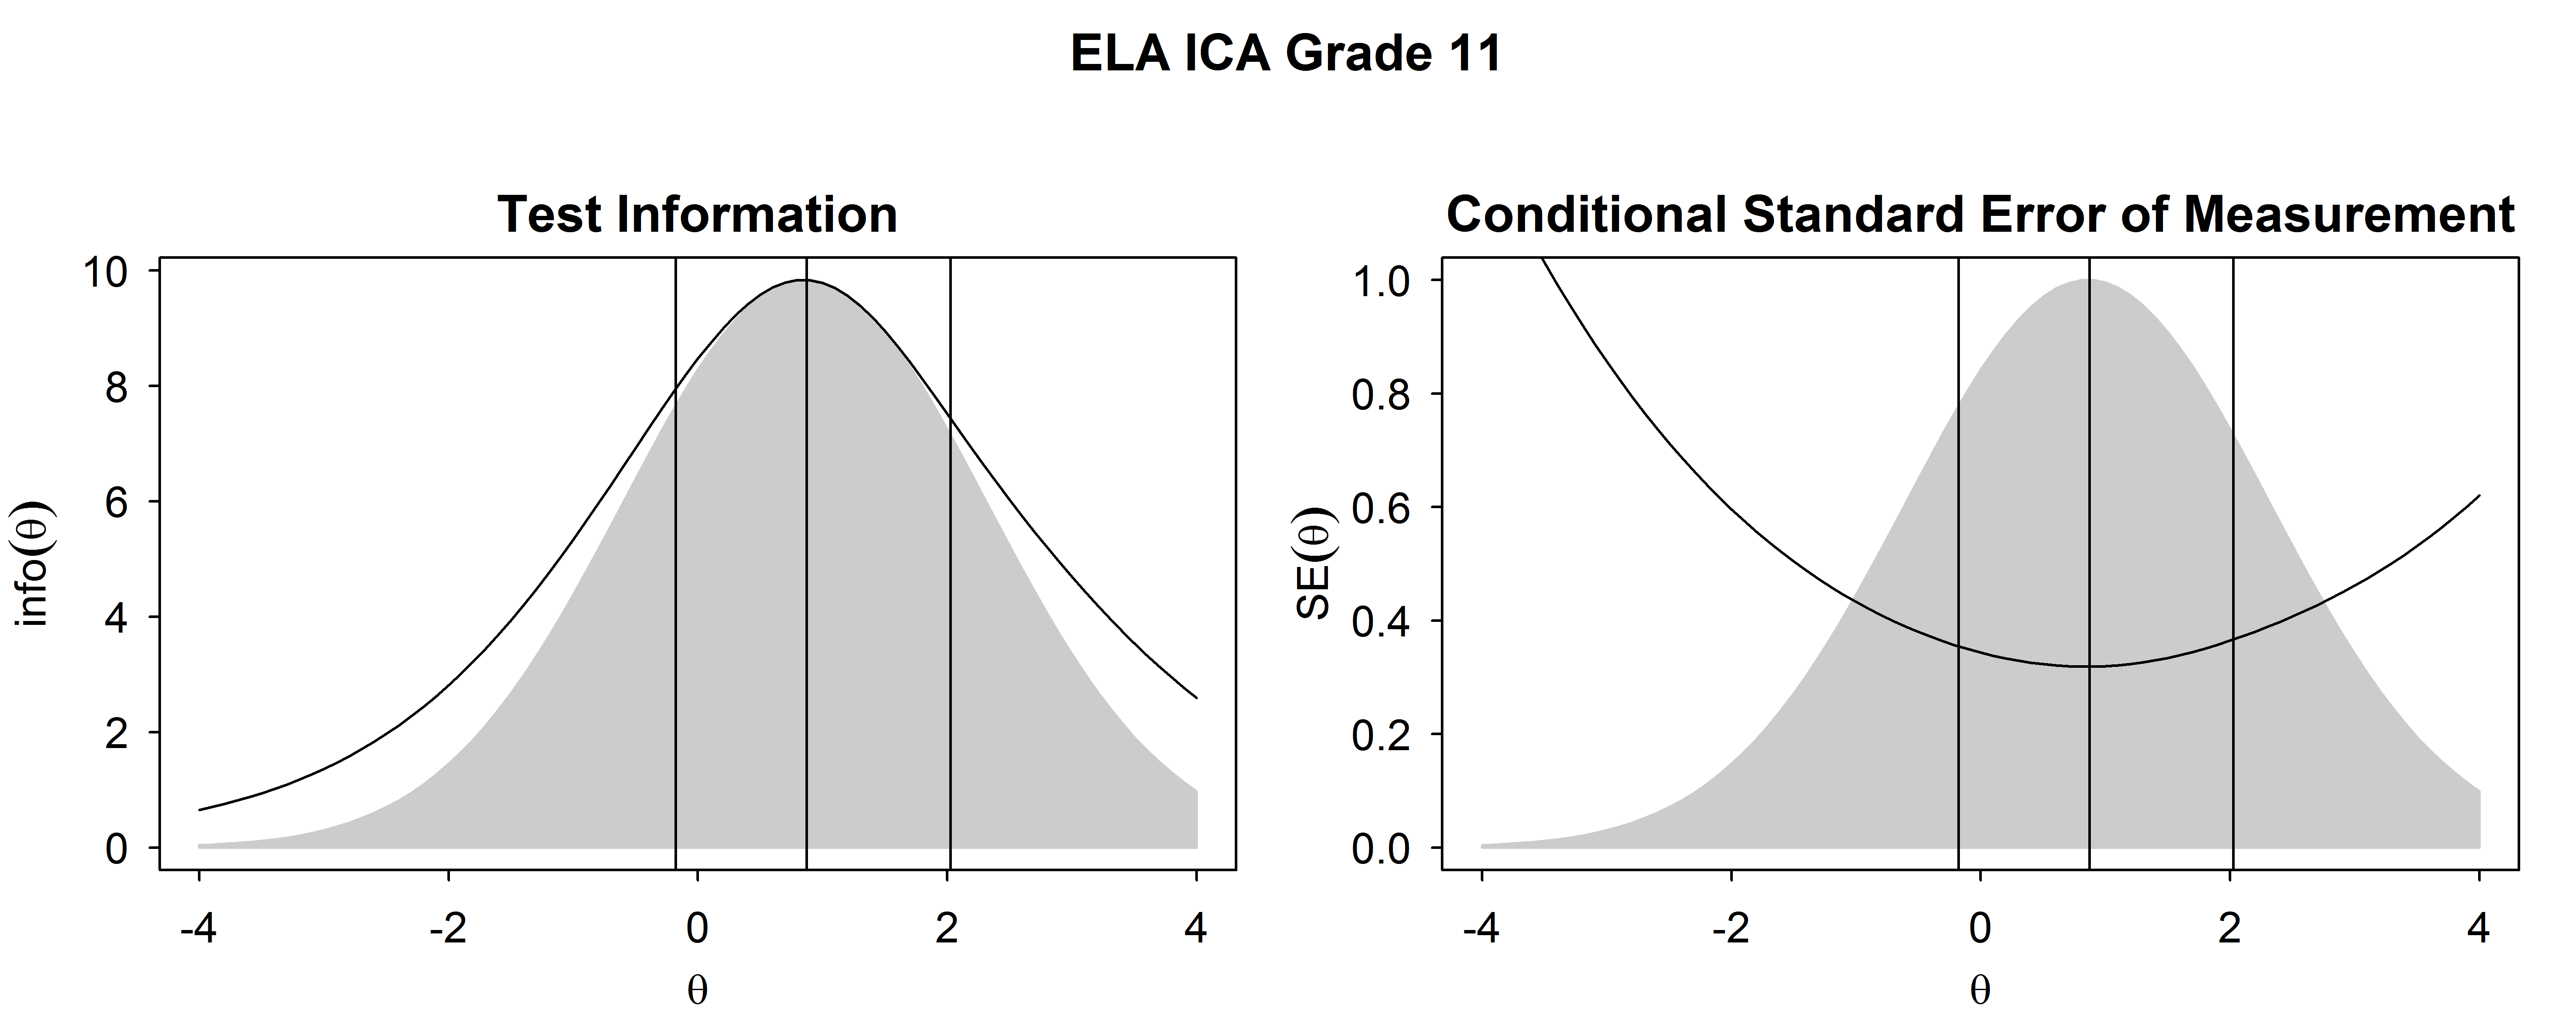
Figure 2.7: Test Information Functions and SEM For ELA/Literacy ICA, High School
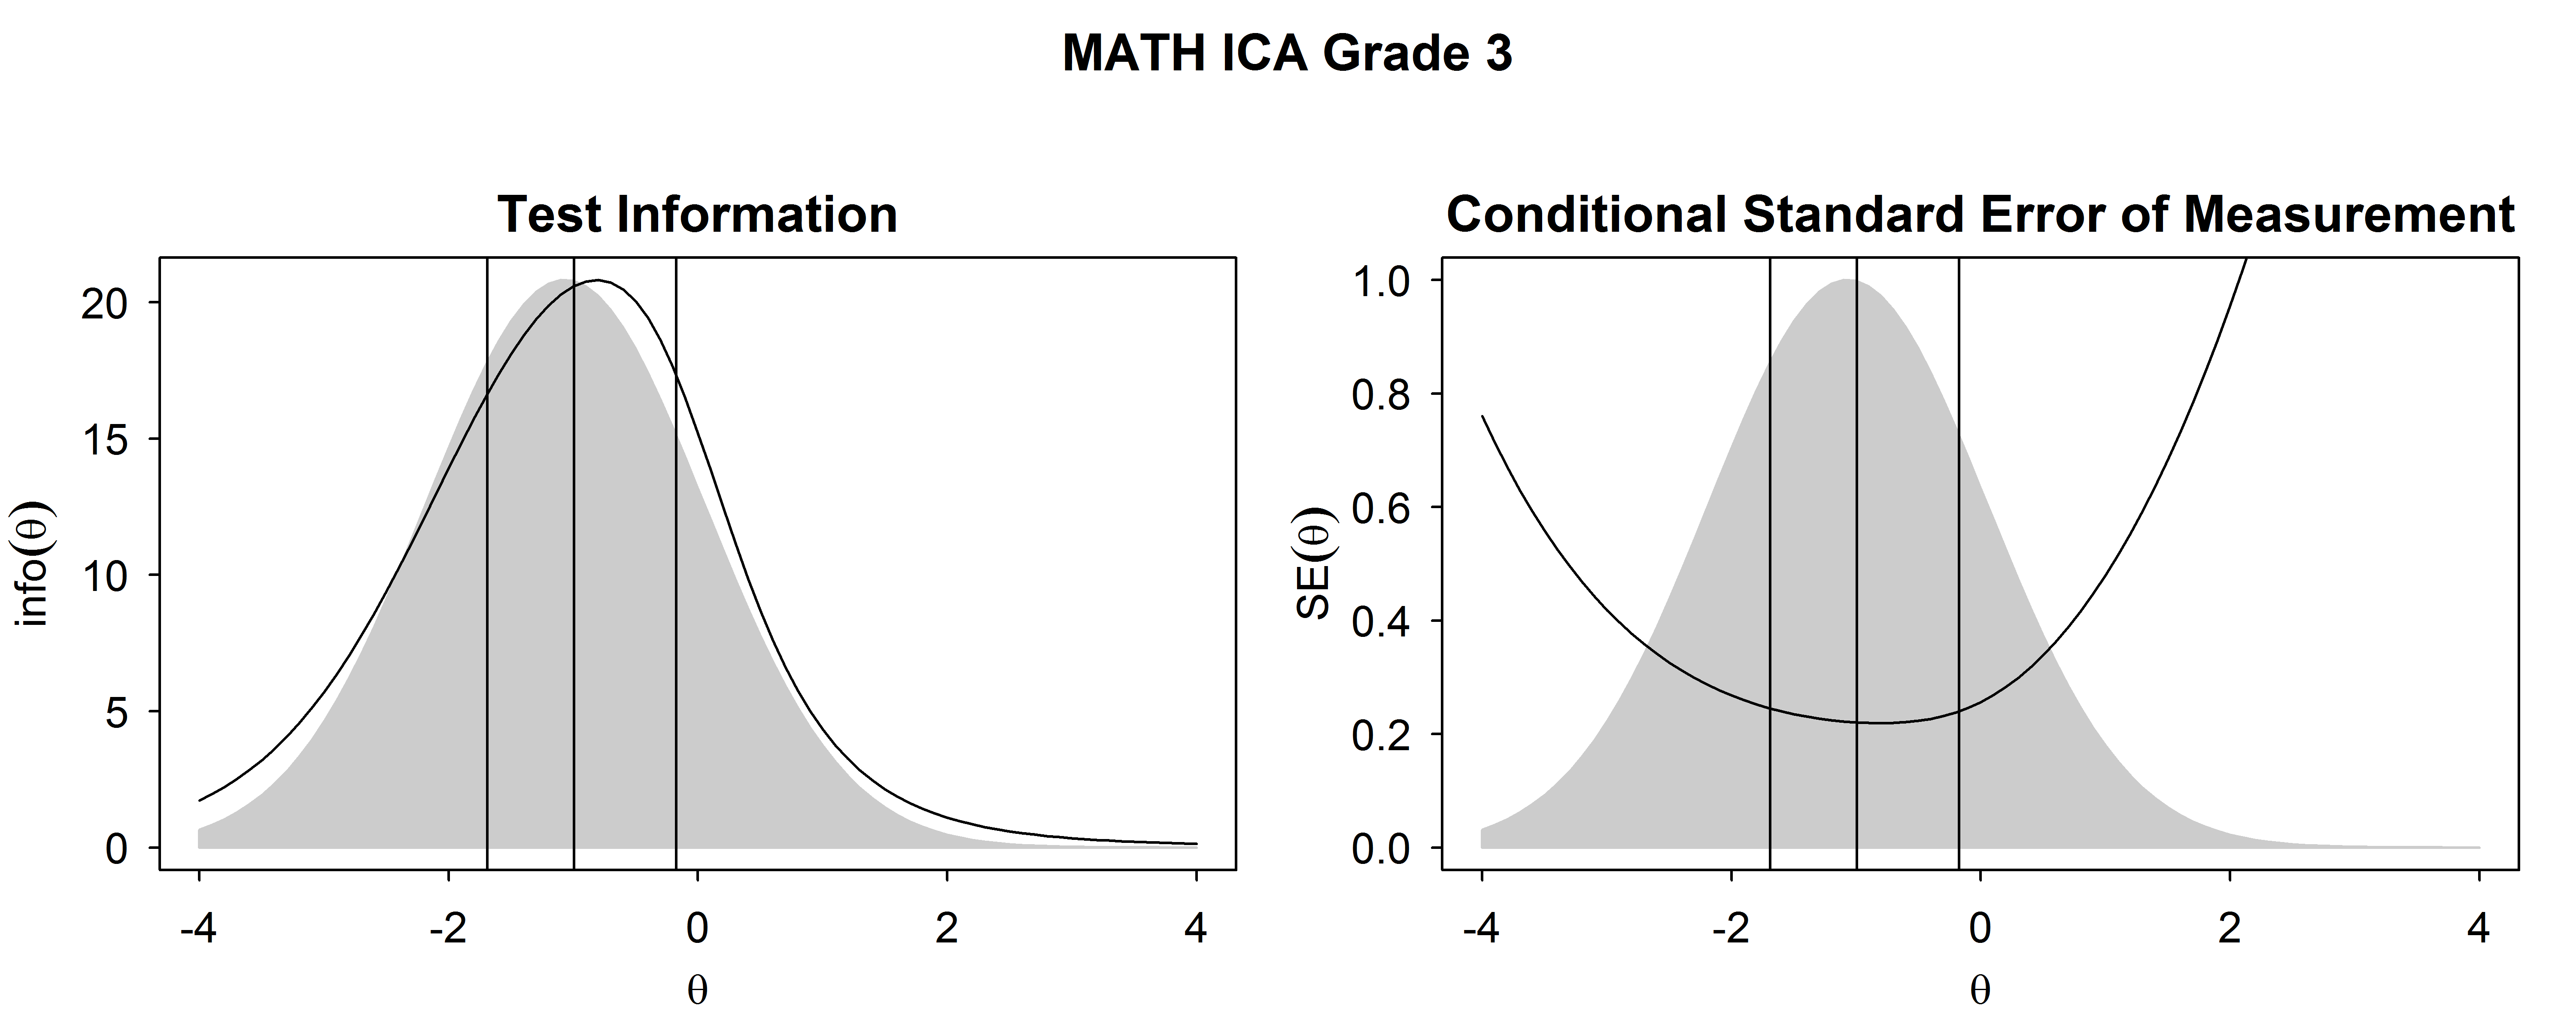
Figure 2.8: Test Information Functions and SEM For Mathematics ICA, Grade 3
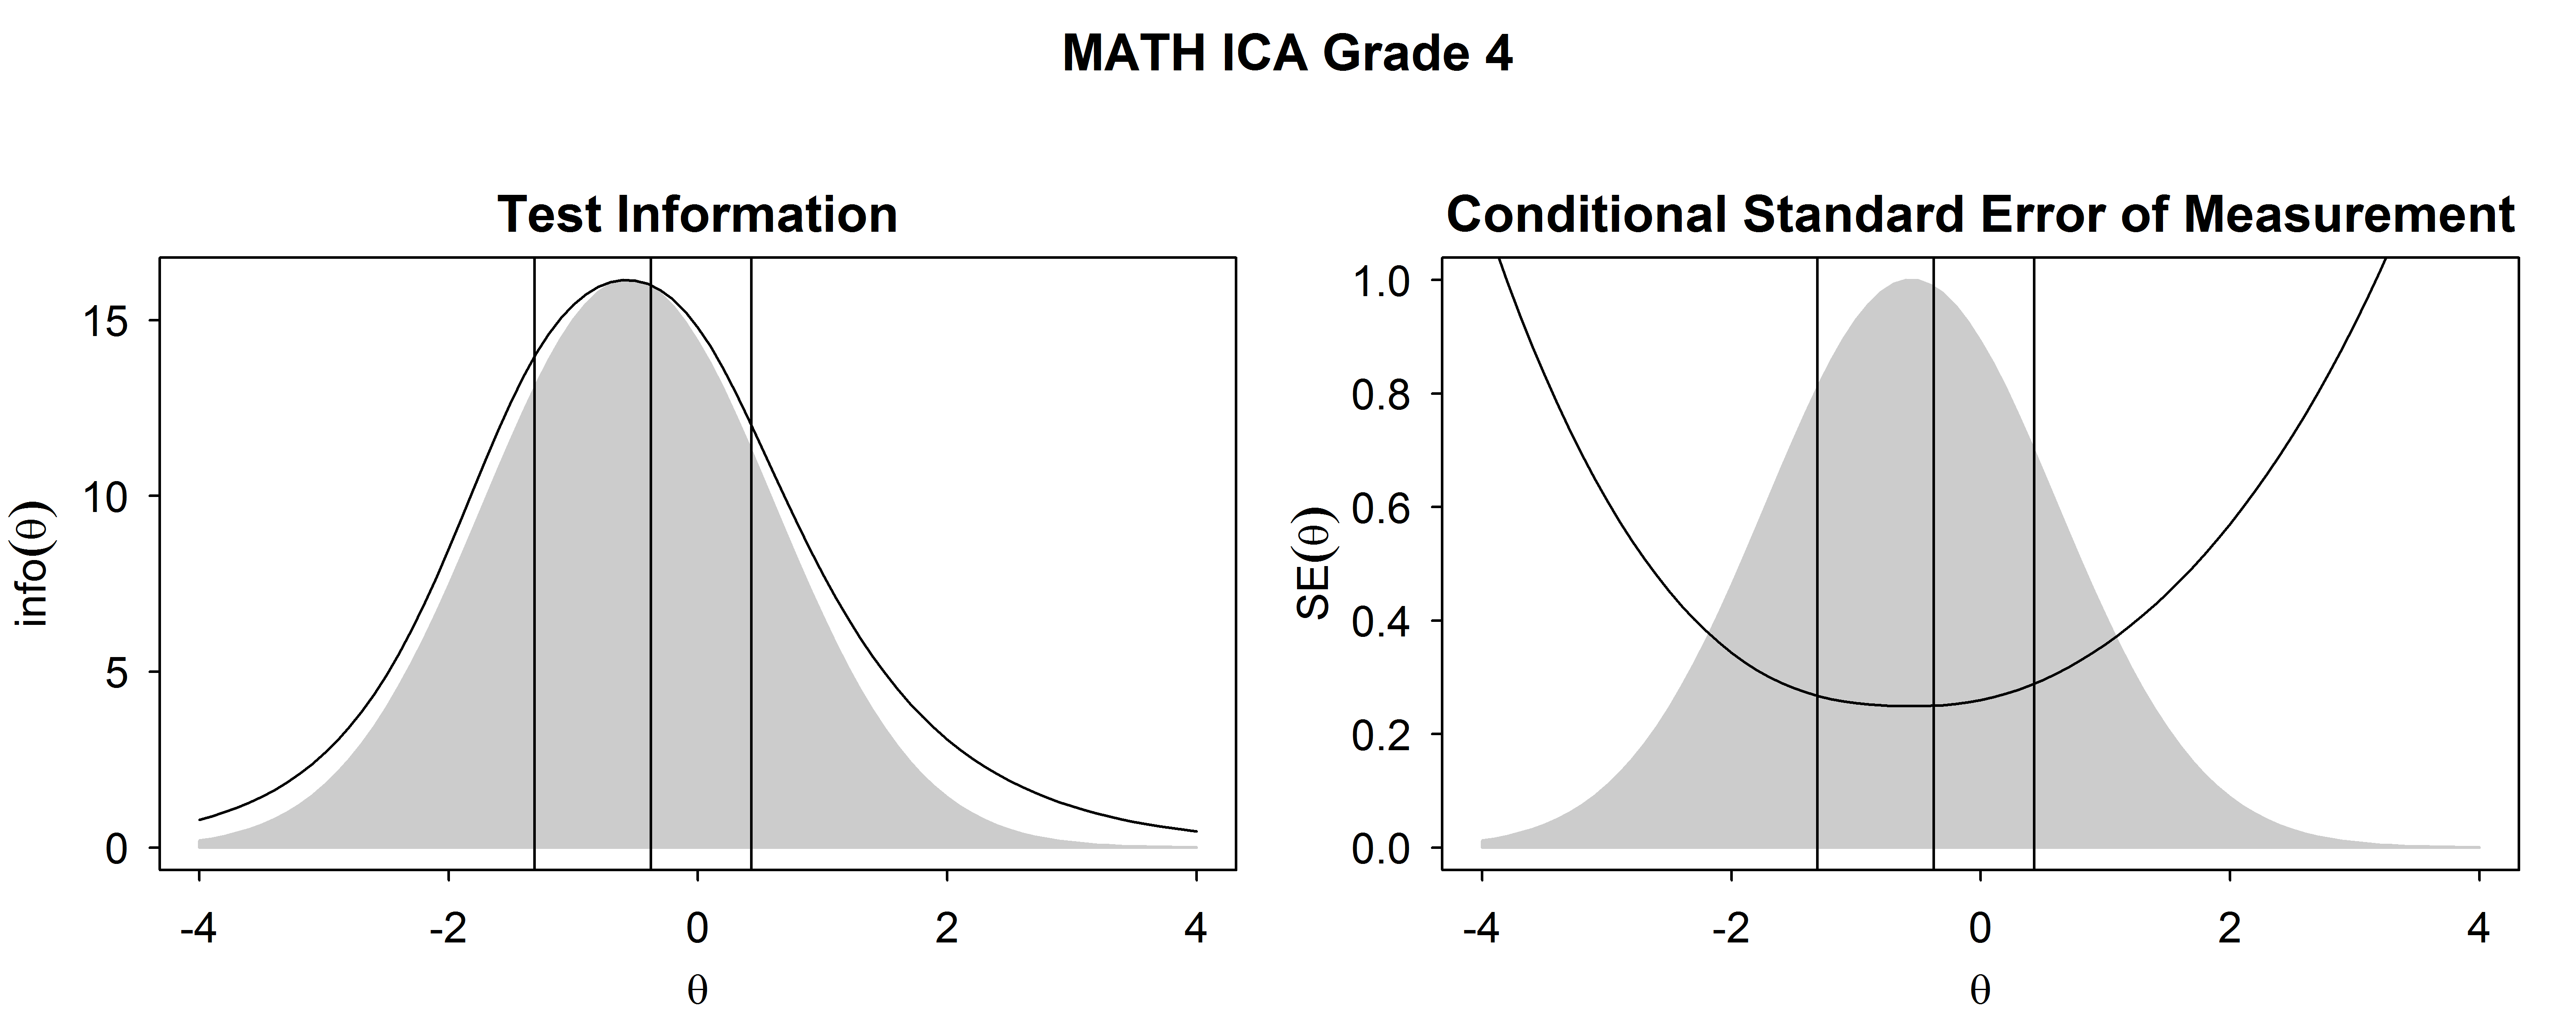
Figure 2.9: Test Information Functions and SEM For Mathematics ICA, Grade 4
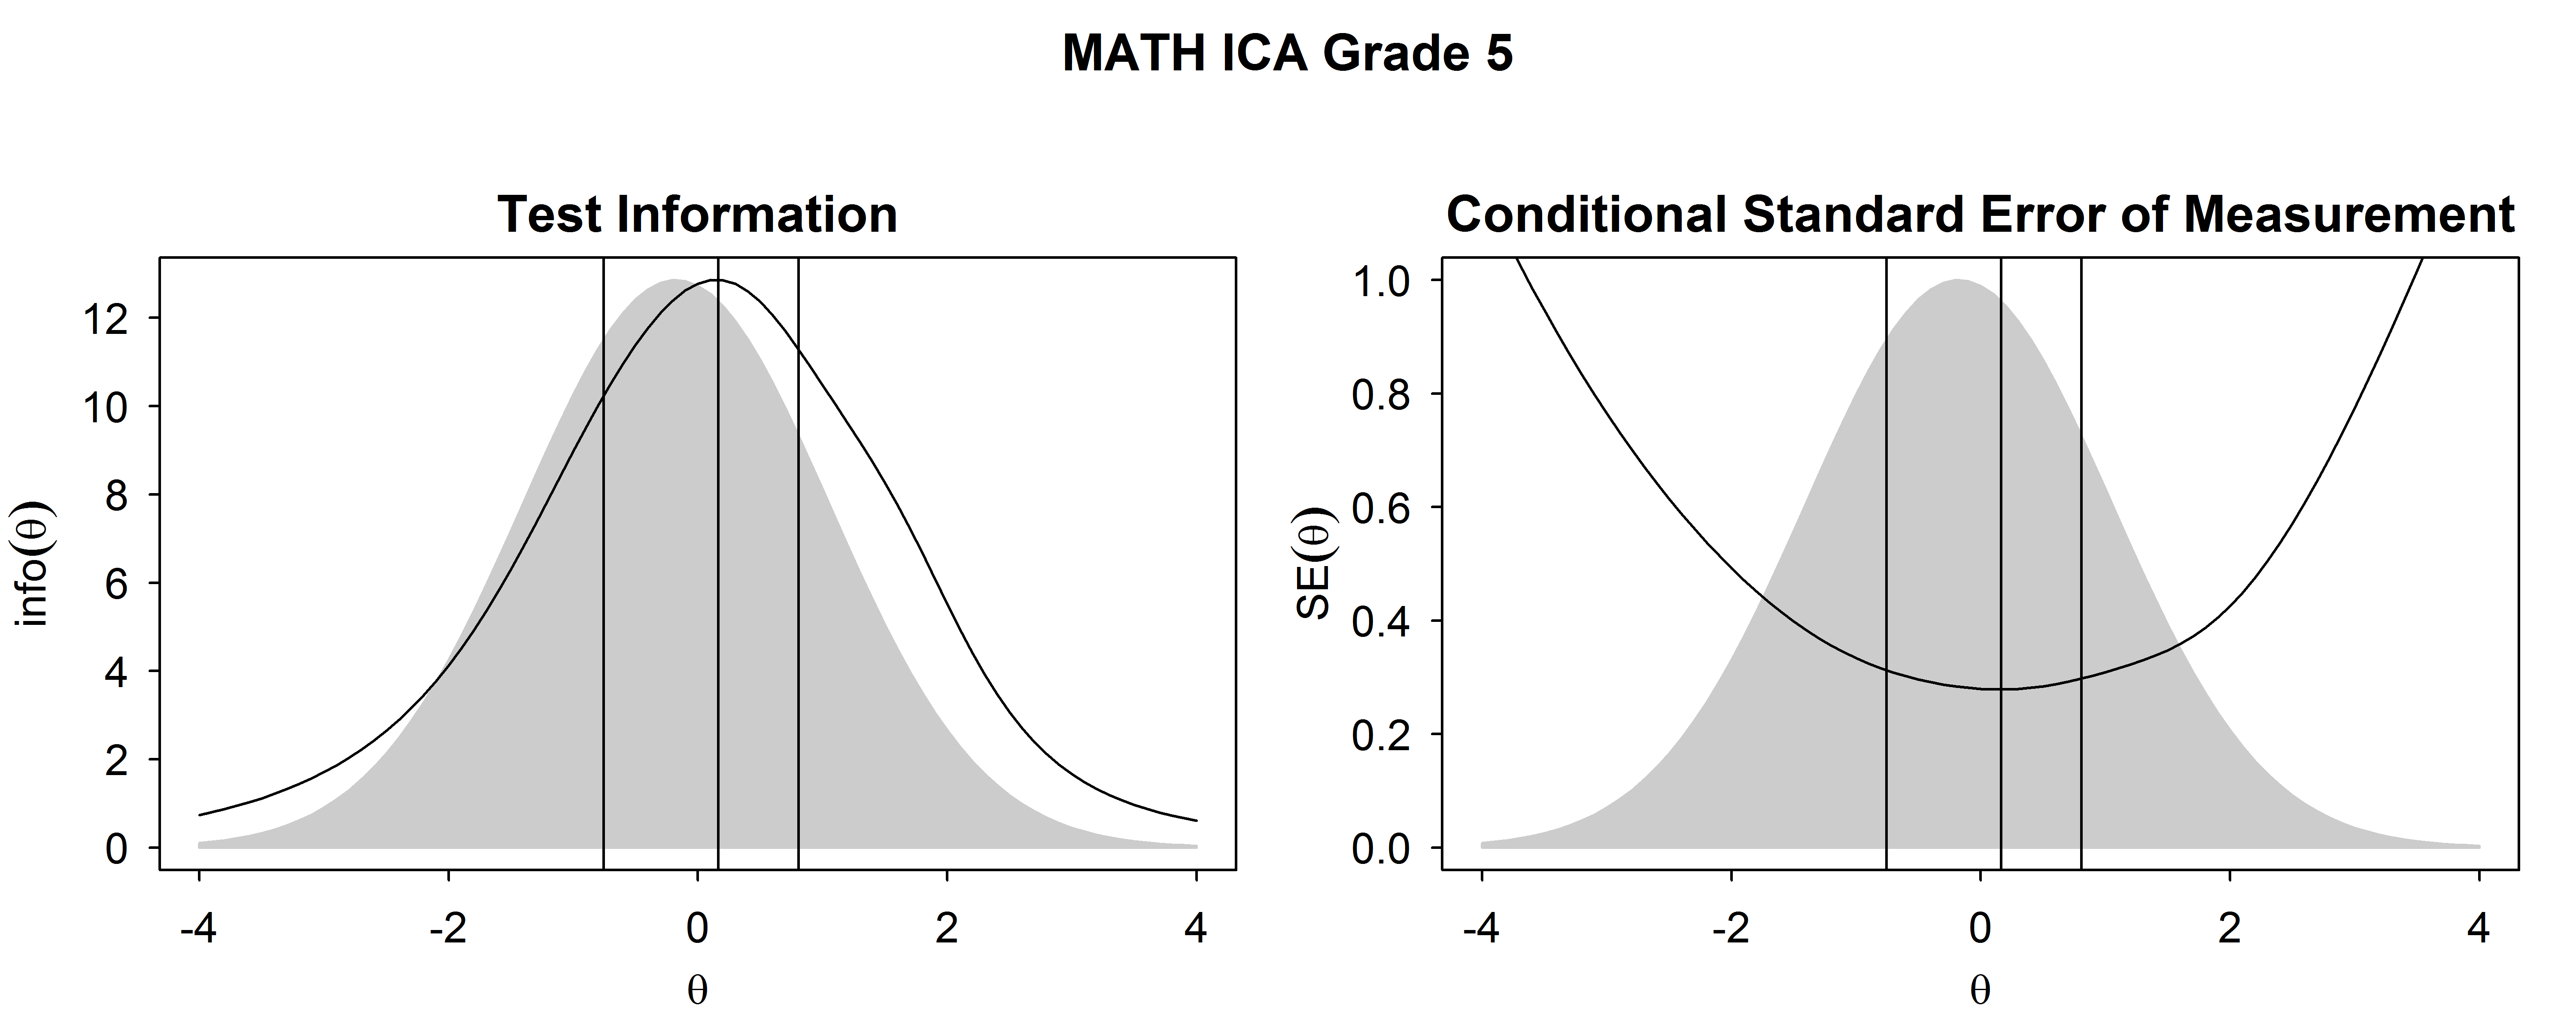
Figure 2.10: Test Information Functions and SEM For Mathematics ICA, Grade 5
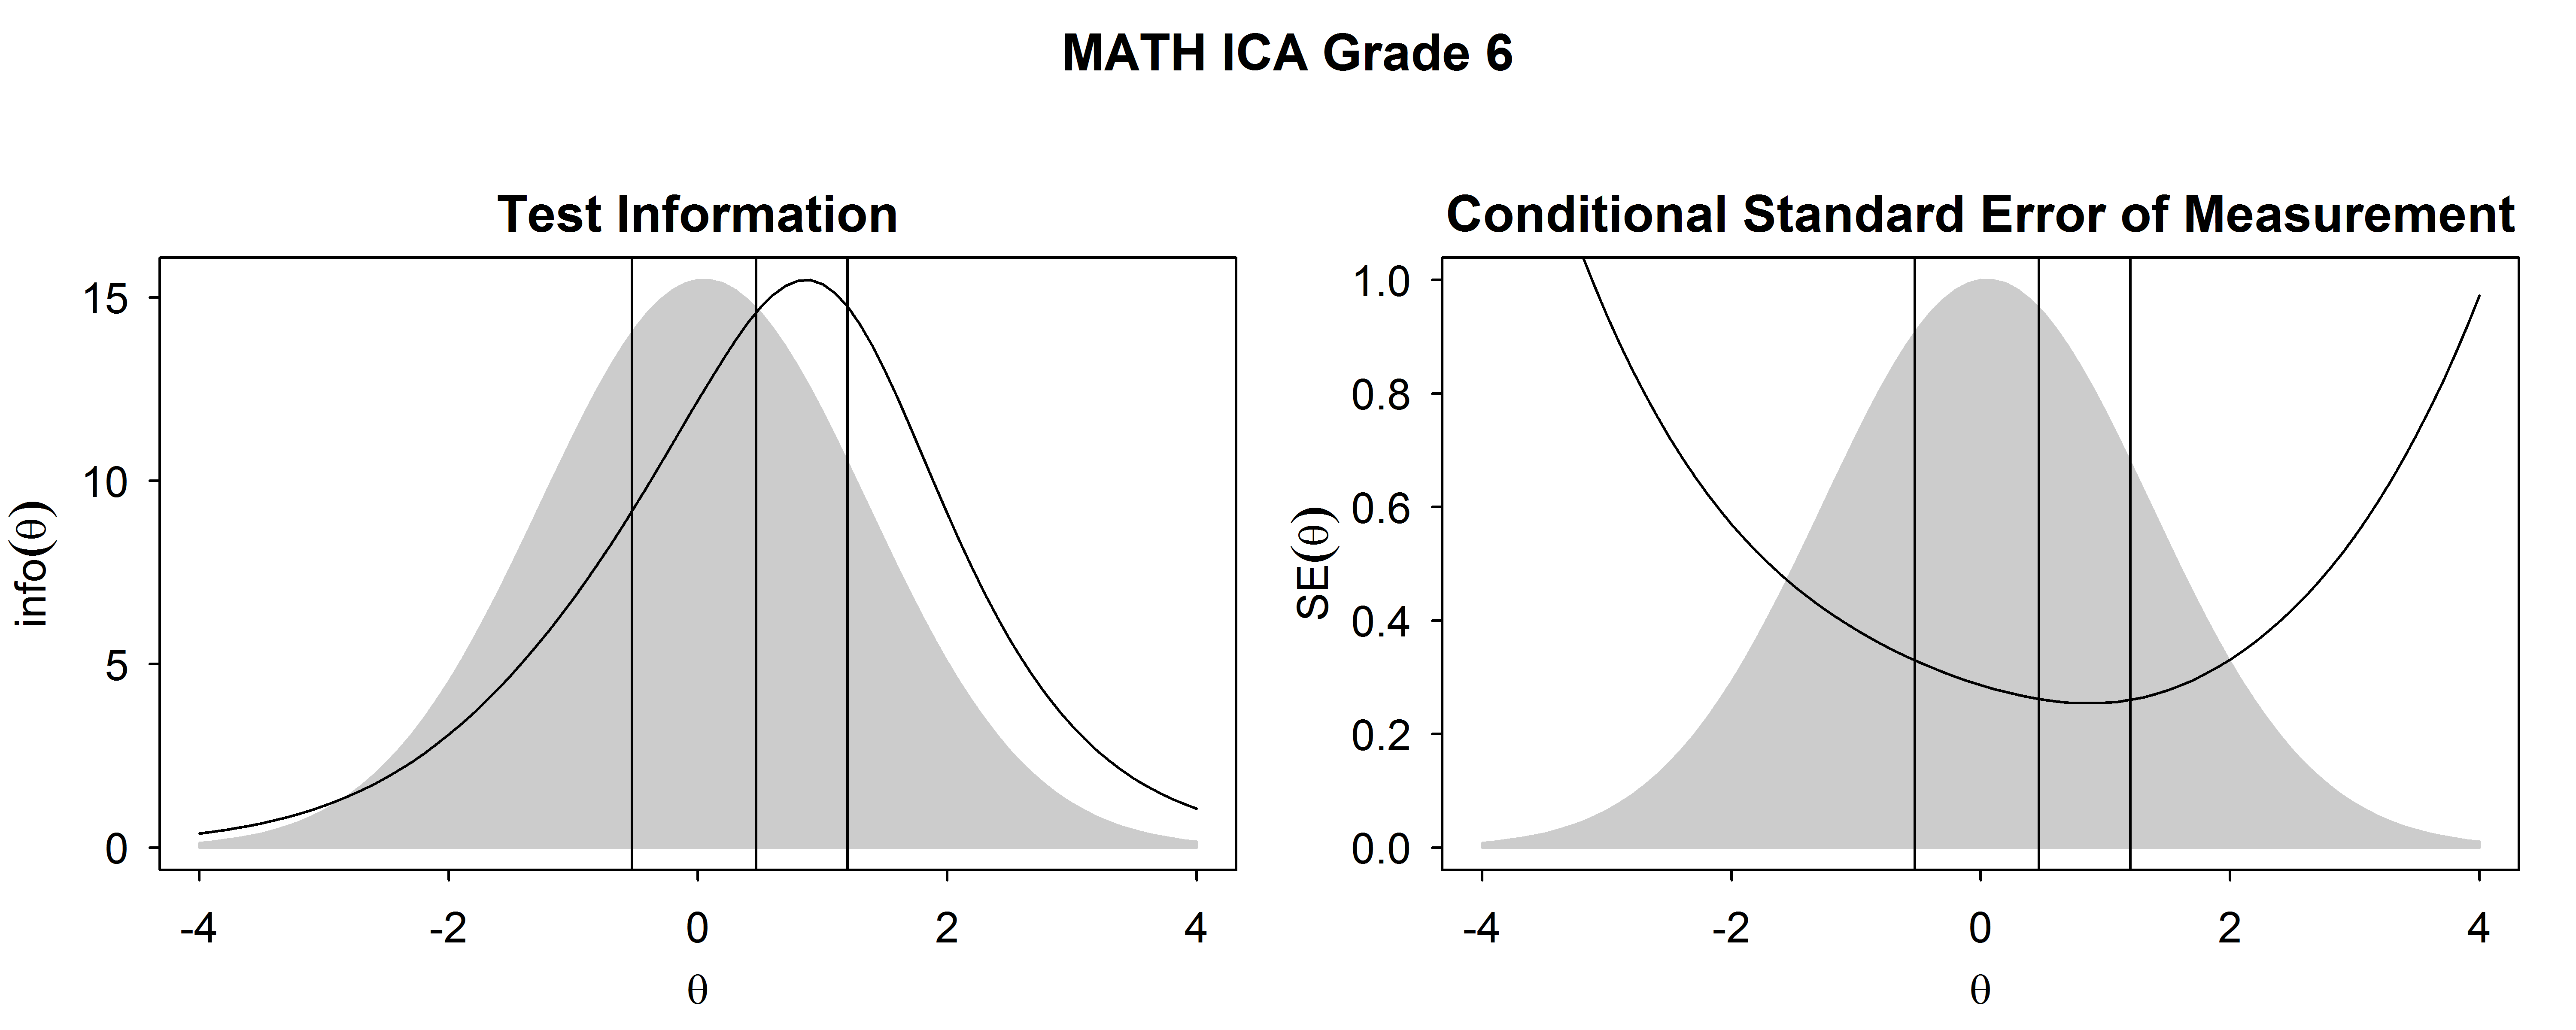
Figure 2.11: Test Information Functions and SEM For Mathematics ICA, Grade 6
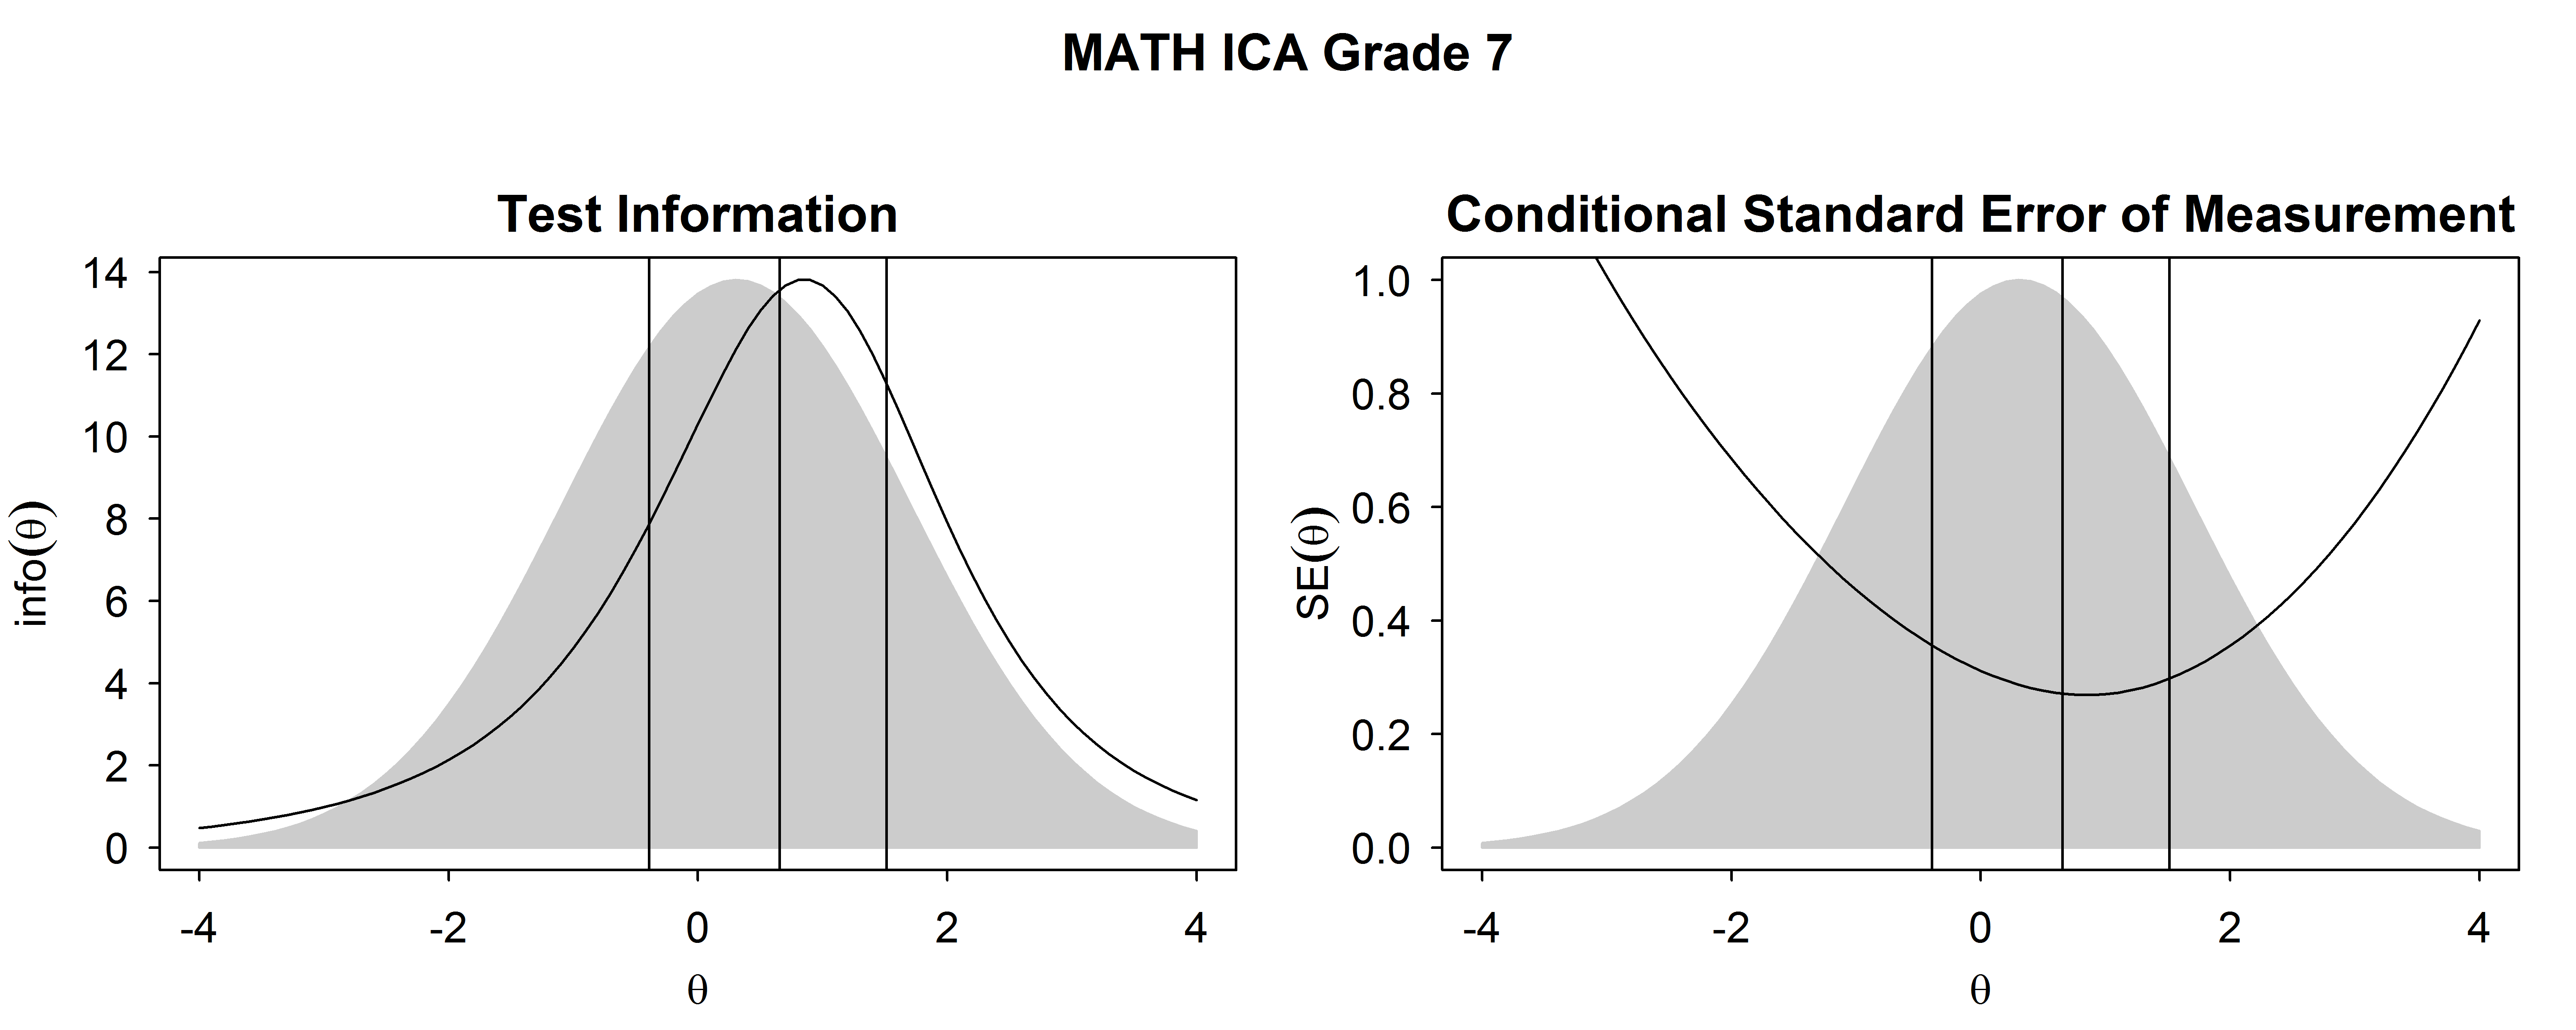
Figure 2.12: Test Information Functions and SEM For Mathematics ICA, Grade 7
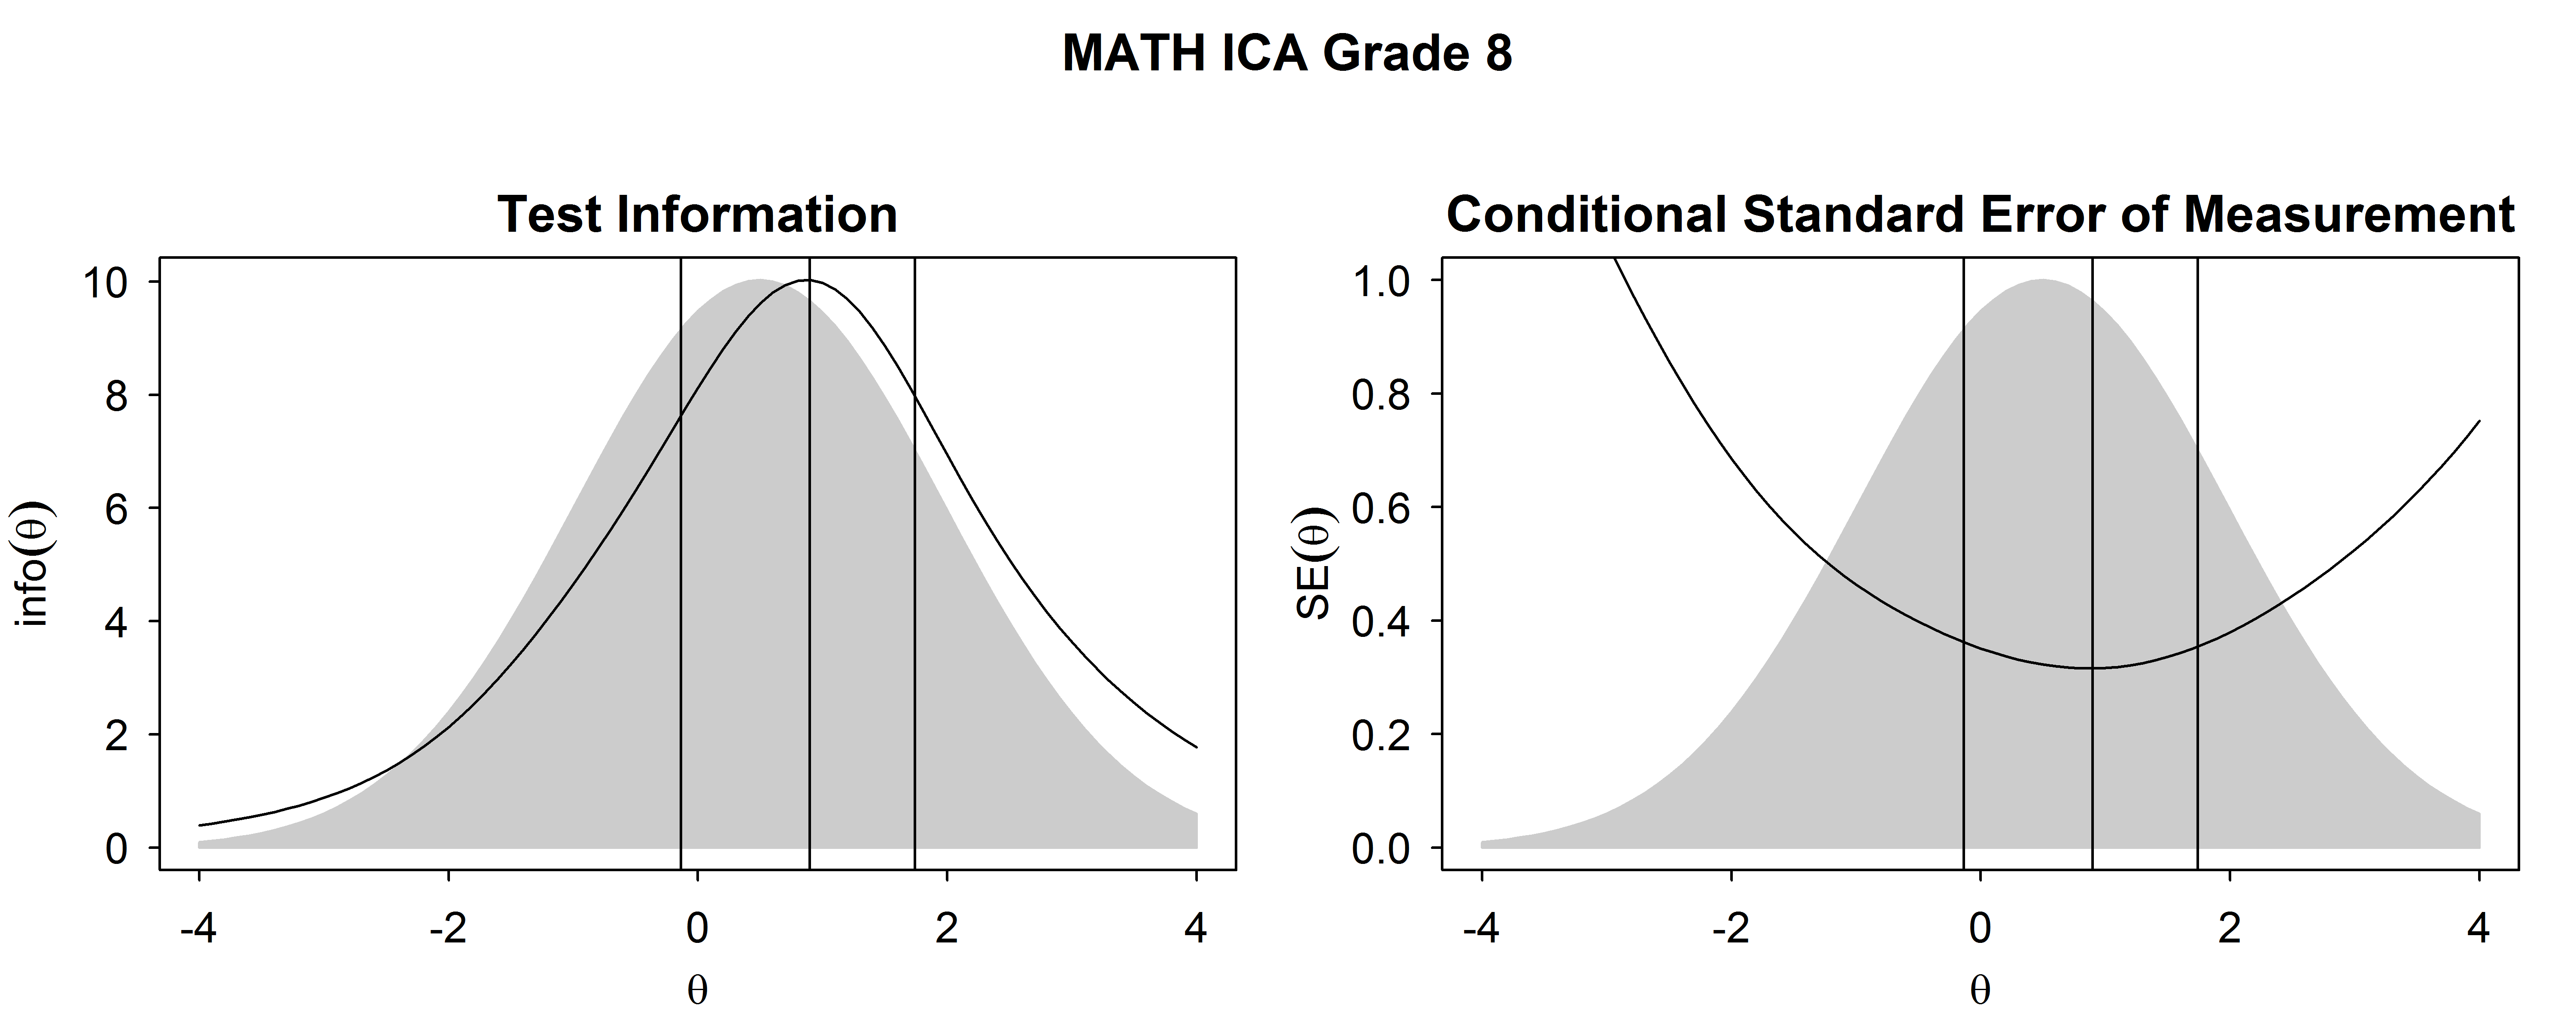
Figure 2.13: Test Information Functions and SEM For Mathematics ICA, Grade 8
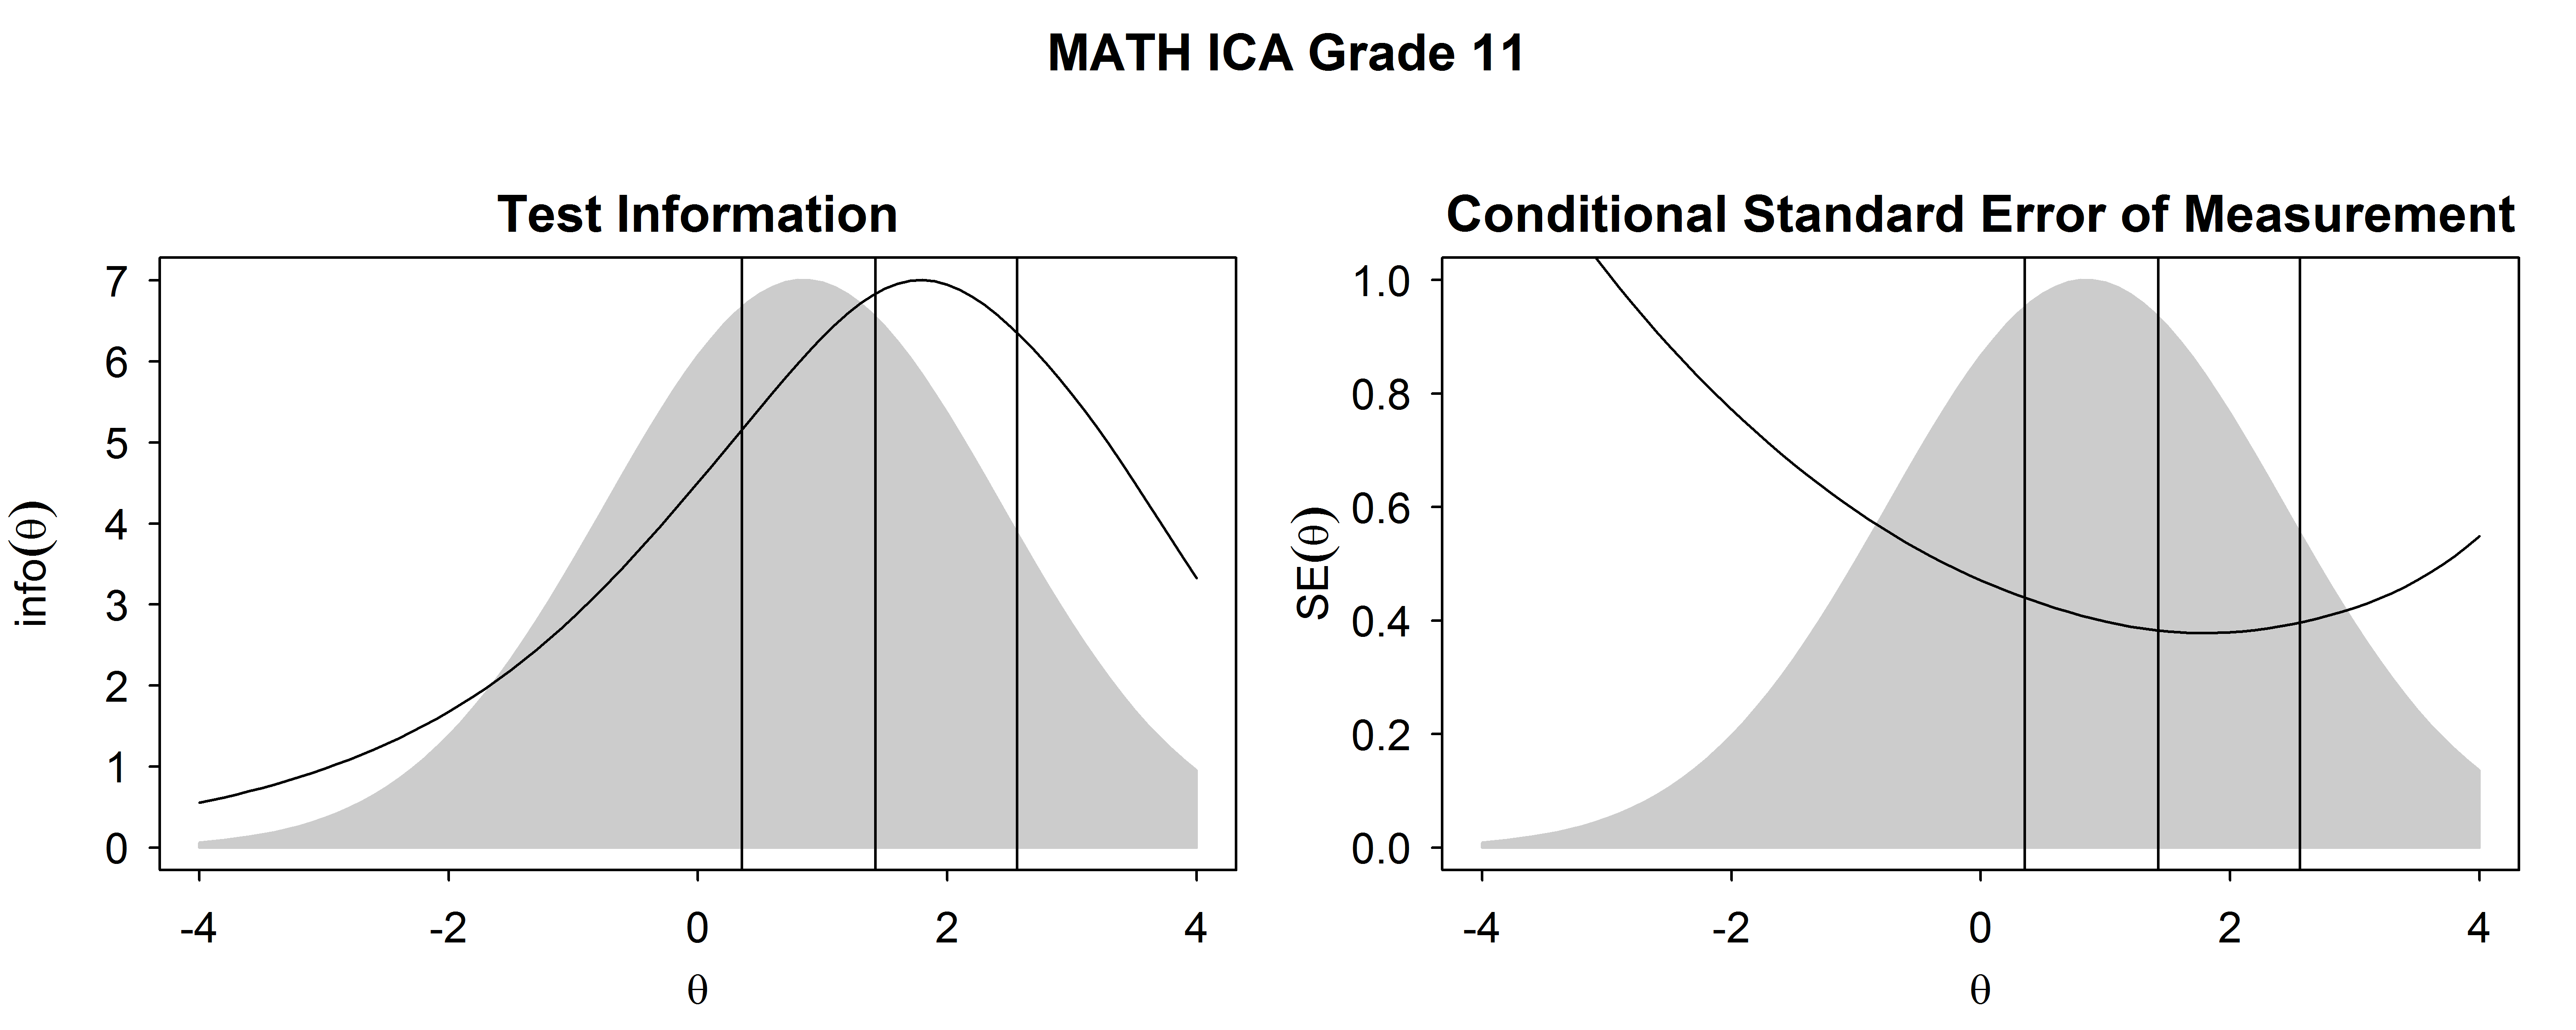
Figure 2.14: Test Information Functions and SEM For Mathematics ICA, High School
The measurement precision of the ICAs for students having the \(\theta\) distributions represented in Table 2.1 (and illustrated in Figure 2.1 to Figure 2.14) is represented by the marginal reliability coefficient and the root mean squared error (RMSE). These indices are shown in Table 2.2 (ELA/literacy) and Table 2.3 (mathematics). The reliability coefficient is:
\[\begin{equation} \hat{\rho} = \frac{var(\theta)}{var(\theta)+MSE} , \tag{2.3} \end{equation}\]
where \(var(\theta)\) is the \(\sigma^2\) from Table 2.1. The mean squared error (MSE) is explained below. The reliability of a test is partly a function of its precision and partly a function of true differences in ability among students. A reliability coefficient of 0 indicates that measured differences among students are completely unreliable. A reliability coefficient of 1 indicates that the measured differences among students are completely reliable.
The reliability coefficient, \(\hat{\rho}\), was calculated for the overall score and claim scores for the ICAs. Reliability and RMSE are not reported for the IABs or FIABs because scale scores are not reported. IAB and FIAB results are reported in terms of whether the student is below, near, or above standard, where the level 3 cut score is the standard. For computing the reliability of claim scores, student measures of true “claim” achievement were assumed to have the same \(\theta\) distribution as overall student achievement.
The MSE is the average of \(SEM(\theta_{i})^2\) for a given \(\theta\) distribution. The RMSE is the square root of MSE. For each grade within subject, true \(\theta\) values were assumed to have a normal distribution with mean and SD equal to the values shown in Table 2.1. Then for each value of true \(\theta\), SEM was calculated using the test items’ IRT parameters. Then, the integral of the SEM over true \(\theta\) was approximated by averaging over 100 quadrature points. For a given test, the MSE was then estimated as:
\[\begin{equation} MSE = \sum_{i=1}^N w(\theta_i)SEM(\theta_{i})^2, \tag{2.4} \end{equation}\]
where \(N\) is the number of quadrature points (100) bounded by the lowest and highest obtainable \(\theta\), \(w\) is the weighted density based on the normal distribution of the true \(\theta\), and \(\sum_{i=1}^N w(\theta_i) =1\).
Reliability and RMSE results for the 2021-22 school year are provided in Table 2.2 and Table 2.3. As expected, reliability coefficients for the ICAs are high and the RMSEs are small and in the acceptable range for a large-scale test. Reliability estimates are lower and RMSE is higher for the ICA claim-level scores than for the overall scores. Claims with fewer items and fewer points exhibit the lowest reliability and the highest RMSE.
| Grade | Full Test Nitems | Full Test Reliability | Claim 1 Reliability | Claim 2 Reliability | Claim 3 Reliability | Claim 4 Reliability | Full Test RMSE | Claim 1 RMSE | Claim 2 RMSE | Claim 3 RMSE | Claim 4 RMSE |
|---|---|---|---|---|---|---|---|---|---|---|---|
| 3 | 40 | 0.92 | 0.79 | 0.78 | 0.66 | 0.68 | 0.31 | 0.53 | 0.55 | 0.75 | 0.71 |
| 4 | 42 | 0.92 | 0.81 | 0.73 | 0.59 | 0.70 | 0.32 | 0.53 | 0.66 | 0.90 | 0.70 |
| 5 | 42 | 0.93 | 0.82 | 0.75 | 0.66 | 0.75 | 0.32 | 0.54 | 0.66 | 0.81 | 0.65 |
| 6 | 43 | 0.93 | 0.80 | 0.80 | 0.65 | 0.74 | 0.34 | 0.60 | 0.61 | 0.88 | 0.72 |
| 7 | 43 | 0.93 | 0.85 | 0.80 | 0.62 | 0.68 | 0.35 | 0.55 | 0.63 | 1.00 | 0.87 |
| 8 | 41 | 0.94 | 0.84 | 0.81 | 0.60 | 0.78 | 0.34 | 0.59 | 0.67 | 1.12 | 0.72 |
| 9 | 41 | 0.94 | 0.85 | 0.77 | 0.70 | 0.74 | 0.38 | 0.60 | 0.79 | 0.96 | 0.87 |
| 10 | 41 | 0.94 | 0.85 | 0.77 | 0.70 | 0.74 | 0.38 | 0.60 | 0.79 | 0.96 | 0.87 |
| 11 | 41 | 0.94 | 0.85 | 0.77 | 0.70 | 0.74 | 0.38 | 0.60 | 0.79 | 0.96 | 0.87 |
| Grade | Full Test N items | Full Test Reliability | Claim 1 Reliability | Claim 2/4 Reliability | Claim 3 Reliability | Full Test RMSE | Claim 1 RMSE | Claim 2/4 RMSE | Claim 3 RMSE |
|---|---|---|---|---|---|---|---|---|---|
| 3 | 37 | 0.94 | 0.88 | 0.71 | 0.74 | 0.29 | 0.40 | 0.71 | 0.65 |
| 4 | 36 | 0.93 | 0.88 | 0.75 | 0.61 | 0.32 | 0.42 | 0.68 | 0.92 |
| 5 | 37 | 0.92 | 0.85 | 0.70 | 0.74 | 0.36 | 0.52 | 0.80 | 0.72 |
| 6 | 36 | 0.93 | 0.87 | 0.67 | 0.69 | 0.37 | 0.50 | 0.92 | 0.87 |
| 7 | 37 | 0.92 | 0.86 | 0.74 | 0.69 | 0.41 | 0.57 | 0.83 | 0.94 |
| 8 | 37 | 0.92 | 0.86 | 0.77 | 0.68 | 0.43 | 0.59 | 0.79 | 1.00 |
| 9 | 37 | 0.92 | 0.87 | 0.70 | 0.68 | 0.46 | 0.61 | 1.03 | 1.08 |
| 10 | 37 | 0.92 | 0.87 | 0.70 | 0.68 | 0.46 | 0.61 | 1.03 | 1.08 |
| 11 | 38 | 0.92 | 0.85 | 0.74 | 0.65 | 0.48 | 0.67 | 0.94 | 1.15 |
2.3 Classification Accuracy
Classification accuracy is the degree of consistency between the observed achievement level (from the observed scores) and the true achievement level (from the population distribution). Classification accuracy was calculated for each exam based on the item parameters and population \(\theta\) mean \(\mu\) and standard deviation \(\sigma\) in Table 2.1, based on the assumptions that the parameters are known, \(\theta \sim \mathcal{N}(\mu, \sigma^2)\), and \(\hat{\theta_i} \sim \mathcal{N}(\theta_i,SEM_i^2)\). Classification accuracy for for achievement level \(j\) is defined as
\[\begin{equation} CA_j = \sum_{i=1}^N g_j(\theta_i)P(min_j\le \hat{\theta_i}<max_j | min_j\le \theta_i<max_j), \tag{2.5} \end{equation}\]
where \(min_j\) and \(max_j\) are the lower and upper \(\theta\) boundary for achievement level \(j\), \(N\) is the number of quadrature points (100) between \(min_j\) and \(max_j\), \(g\) is the weighted density based on the normal distribution of the true \(\theta\), and \(\sum_{i=1}^N g_j(\theta_i) =1\). This can be calculated after obtaining \(SEM_i\) from (2.1).
In addition, proportion of students assigned to achievement level \(j\) is calculated as
\[\begin{equation} PA_j = \sum_{i=1}^N w(\theta_i)P(min_j\le \hat{\theta_i}<max_j | \theta_i), \tag{2.6} \end{equation}\]
which is similar to (2.5), except the true \(\theta\) range spans the entire length of its distribution between the the lowest and highest obtainable \(\theta\) score. The overall classification accuracy is the proportion of students among those assigned to any achievement level who are correctly assigned, which is \(\sum{(PA_j*CA_j)}\).
For overall scores, we used a weighted Kappa to describe the classification accuracy into the four achievement levels. Claim and IAB/FIAB scores were evaluated with respect to the cut score between levels 2 and 3, which represents the minimum standard for proficiency for the subject and grade level. For each claim, students are classified as “above” or “below” the standard when the estimated score is at least 1.5 standard errors above or below the cut score. When the estimated score is within 1.5 standard errors, the student is classified as “near” the standard. Claim or IAB/FIAB scores with larger average standard errors can thus be expected to have a greater proportion of students classified as “near” the standard. Because such classifications cannot be treated as a misclassification (“near” is only defined in terms of the standard error of measurement), the proportions correctly classified focus on those students who were classified as “above” or “below.”
Table 2.4 shows the cut scores used for classifying examinees into achievement levels based on their overall test performance. The level 2 versus 3 cut score is also used to classify students by their performance on items specific to a claim—by their claim scores—and their performance on the IABs/FIABs.
| Grade | Subject | Level1v2 | Level2v3 | Level3v4 |
|---|---|---|---|---|
| 3 | ELA/literacy | -1.646 | -0.888 | -0.212 |
| 4 | ELA/literacy | -1.075 | -0.410 | 0.289 |
| 5 | ELA/literacy | -0.772 | -0.072 | 0.860 |
| 6 | ELA/literacy | -0.597 | 0.266 | 1.280 |
| 7 | ELA/literacy | -0.340 | 0.510 | 1.641 |
| 8 | ELA/literacy | -0.247 | 0.685 | 1.862 |
| 9 | ELA/literacy | -0.224 | 0.732 | 1.909 |
| 10 | ELA/literacy | -0.200 | 0.802 | 1.979 |
| 11 | ELA/literacy | -0.177 | 0.872 | 2.026 |
| 3 | Mathematics | -1.689 | -0.995 | -0.175 |
| 4 | Mathematics | -1.310 | -0.377 | 0.430 |
| 5 | Mathematics | -0.755 | 0.165 | 0.808 |
| 6 | Mathematics | -0.528 | 0.468 | 1.199 |
| 7 | Mathematics | -0.390 | 0.657 | 1.515 |
| 8 | Mathematics | -0.137 | 0.897 | 1.741 |
| 9 | Mathematics | 0.026 | 1.086 | 2.032 |
| 10 | Mathematics | 0.228 | 1.250 | 2.296 |
| 11 | Mathematics | 0.354 | 1.426 | 2.561 |
Table 2.5 and Table 2.6 show the classification accuracy for the IAB scores in ELA/literacy and mathematics for all grades. Each table shows the proportion of students assigned to each category with respect to the level 3 cut score standard and the proportion among those assigned to each category and overall who were correctly classified. Classification accuracy was high for all categories.
| Grade | Block Name | Prop Assigned Below Standard | Prop Assigned Near Standard | Prop Assigned Above Standard | Prop Correctly Clasified Below Standard | Prop Correctly Classified Above Standard |
|---|---|---|---|---|---|---|
| 3 | Brief Writes | 0.22 | 0.56 | 0.22 | 0.97 | 0.94 |
| Performance Task | 0.22 | 0.56 | 0.22 | 0.97 | 0.95 | |
| Read Informational Texts | 0.25 | 0.52 | 0.23 | 0.97 | 0.97 | |
| Read Literary Texts | 0.31 | 0.41 | 0.29 | 0.98 | 0.98 | |
| Research | 0.27 | 0.48 | 0.25 | 0.98 | 0.98 | |
| Revision | 0.27 | 0.48 | 0.25 | 0.98 | 0.98 | |
| 4 | Brief Writes | 0.22 | 0.57 | 0.21 | 0.97 | 0.96 |
| Performance Task | 0.24 | 0.52 | 0.24 | 0.98 | 0.95 | |
| Read Informational Texts | 0.24 | 0.53 | 0.23 | 0.98 | 0.96 | |
| Read Literary Texts | 0.28 | 0.47 | 0.25 | 0.98 | 0.98 | |
| Research | 0.27 | 0.49 | 0.24 | 0.98 | 0.98 | |
| Revision | 0.23 | 0.56 | 0.21 | 0.97 | 0.97 | |
| 5 | Brief Writes | 0.22 | 0.58 | 0.20 | 0.97 | 0.96 |
| Performance Task | 0.26 | 0.50 | 0.25 | 0.98 | 0.97 | |
| Read Informational Texts | 0.23 | 0.55 | 0.22 | 0.98 | 0.96 | |
| Read Literary Texts | 0.25 | 0.52 | 0.24 | 0.98 | 0.97 | |
| Research | 0.29 | 0.44 | 0.27 | 0.98 | 0.98 | |
| Revision | 0.26 | 0.51 | 0.24 | 0.98 | 0.97 | |
| 6 | Brief Writes | 0.27 | 0.53 | 0.20 | 0.98 | 0.95 |
| Performance Task | 0.30 | 0.48 | 0.22 | 0.98 | 0.98 | |
| Read Informational Texts | 0.31 | 0.45 | 0.23 | 0.98 | 0.98 | |
| Read Literary Texts | 0.28 | 0.53 | 0.19 | 0.98 | 0.97 | |
| Research | 0.33 | 0.42 | 0.25 | 0.99 | 0.98 | |
| Revision | 0.25 | 0.58 | 0.17 | 0.97 | 0.96 | |
| 7 | Brief Writes | 0.27 | 0.53 | 0.20 | 0.98 | 0.96 |
| Performance Task | 0.31 | 0.47 | 0.22 | 0.98 | 0.97 | |
| Read Informational Texts | 0.32 | 0.45 | 0.23 | 0.99 | 0.98 | |
| Read Literary Texts | 0.34 | 0.43 | 0.24 | 0.99 | 0.98 | |
| Research | 0.28 | 0.51 | 0.21 | 0.98 | 0.96 | |
| Revision | 0.29 | 0.51 | 0.20 | 0.98 | 0.97 | |
| 8 | Brief Writes | 0.29 | 0.50 | 0.22 | 0.98 | 0.96 |
| Edit/Revise | 0.30 | 0.49 | 0.20 | 0.98 | 0.98 | |
| Performance Task | 0.31 | 0.47 | 0.23 | 0.98 | 0.98 | |
| Read Informational Texts | 0.32 | 0.42 | 0.25 | 0.99 | 0.97 | |
| Read Literary Texts | 0.35 | 0.39 | 0.25 | 0.99 | 0.98 | |
| Research | 0.31 | 0.46 | 0.23 | 0.98 | 0.98 | |
| 11 | Brief Writes | 0.24 | 0.54 | 0.21 | 0.97 | 0.97 |
| Performance Task | 0.25 | 0.52 | 0.23 | 0.98 | 0.96 | |
| Read Informational Texts | 0.27 | 0.49 | 0.24 | 0.98 | 0.97 | |
| Read Literary Texts | 0.29 | 0.44 | 0.27 | 0.98 | 0.98 | |
| Research | 0.29 | 0.45 | 0.26 | 0.98 | 0.98 | |
| Revision | 0.27 | 0.49 | 0.24 | 0.98 | 0.98 |
| Grade | Block Name | Prop Assigned Below Standard | Prop Assigned Near Standard | Prop Assigned Above Standard | Prop Correctly Classified Below Standard | Prop Correctly Classified Above Standard |
|---|---|---|---|---|---|---|
| 3 | Measurement and Data | 0.33 | 0.39 | 0.28 | 0.99 | 0.99 |
| Operations and Algebraic Thinking | 0.33 | 0.42 | 0.25 | 0.98 | 0.99 | |
| Performance Task | 0.30 | 0.42 | 0.28 | 0.99 | 0.95 | |
| 4 | Measurement and Data | 0.33 | 0.43 | 0.24 | 0.99 | 0.97 |
| Number and Operations - Fractions | 0.38 | 0.36 | 0.25 | 0.99 | 0.98 | |
| Number and Operations in Base Ten | 0.34 | 0.44 | 0.22 | 0.99 | 0.98 | |
| Operations and Algebraic Thinking | 0.37 | 0.40 | 0.23 | 0.99 | 0.98 | |
| Performance Task | 0.29 | 0.51 | 0.20 | 0.99 | 0.93 | |
| 5 | Measurement and Data | 0.39 | 0.41 | 0.20 | 0.99 | 0.98 |
| Number and Operations - Fractions | 0.41 | 0.39 | 0.20 | 0.99 | 0.98 | |
| Number and Operations in Base Ten | 0.37 | 0.45 | 0.18 | 0.99 | 0.97 | |
| Operations and Algebraic Thinking | 0.33 | 0.51 | 0.16 | 0.98 | 0.96 | |
| Performance Task | 0.32 | 0.48 | 0.20 | 0.99 | 0.90 | |
| 6 | Expressions and Equations | 0.42 | 0.37 | 0.20 | 0.99 | 0.98 |
| Performance Task | 0.34 | 0.47 | 0.19 | 0.99 | 0.89 | |
| The Number System | 0.41 | 0.39 | 0.20 | 0.99 | 0.97 | |
| 7 | Expressions and Equations | 0.39 | 0.40 | 0.21 | 0.99 | 0.98 |
| Geometry | 0.32 | 0.48 | 0.20 | 0.99 | 0.93 | |
| Performance Task | 0.35 | 0.43 | 0.22 | 0.99 | 0.95 | |
| 8 | Expressions and Equations I | 0.35 | 0.46 | 0.18 | 0.99 | 0.96 |
| Geometry | 0.34 | 0.47 | 0.18 | 0.99 | 0.96 | |
| Performance Task | 0.34 | 0.48 | 0.17 | 0.98 | 0.96 | |
| 11 | Algebra and Functions I | 0.42 | 0.40 | 0.18 | 0.99 | 0.97 |
| Algebra and Functions II | 0.37 | 0.47 | 0.17 | 0.99 | 0.94 | |
| Geometry Congruence | 0.27 | 0.61 | 0.12 | 0.98 | 0.88 | |
| Geometry Measurement and Modeling | 0.28 | 0.59 | 0.13 | 0.99 | 0.83 | |
| Performance Task | 0.32 | 0.51 | 0.17 | 0.99 | 0.83 |
Table 2.7 and Table 2.8 show the classification accuracy for the FIAB scores in ELA/literacy and mathematics for all grades. All of the classification accuracy for both subjects were high.
| Grade | Block Name | Prop Assigned Below Standard | Prop Assigned Near Standard | Prop Assigned Above Standard | Prop Correctly Clasified Below Standard | Prop Correctly Classified Above Standard |
|---|---|---|---|---|---|---|
| 3 | Editing | 0.25 | 0.53 | 0.22 | 0.97 | 0.98 |
| Language and Vocabulary Use | 0.26 | 0.50 | 0.24 | 0.98 | 0.98 | |
| Listen/Interpret | 0.26 | 0.51 | 0.24 | 0.98 | 0.98 | |
| Research: Analyze Information | 0.22 | 0.57 | 0.20 | 0.96 | 0.96 | |
| Research: Interpret and Integrate | 0.24 | 0.54 | 0.22 | 0.97 | 0.97 | |
| Research: Use Evidence | 0.23 | 0.56 | 0.22 | 0.97 | 0.96 | |
| Write and Revise Informational Texts | 0.22 | 0.58 | 0.20 | 0.96 | 0.97 | |
| Write and Revise Narratives | 0.26 | 0.50 | 0.24 | 0.98 | 0.98 | |
| Write and Revise Opinion Texts | 0.24 | 0.54 | 0.22 | 0.97 | 0.97 | |
| 4 | Editing | 0.24 | 0.56 | 0.20 | 0.97 | 0.97 |
| Language and Vocabulary Use | 0.26 | 0.50 | 0.23 | 0.98 | 0.98 | |
| Listen/Interpret | 0.23 | 0.58 | 0.20 | 0.97 | 0.97 | |
| Research: Analyze Information | 0.24 | 0.54 | 0.21 | 0.97 | 0.97 | |
| Research: Interpret and Integrate | 0.25 | 0.54 | 0.21 | 0.97 | 0.97 | |
| Research: Use Evidence | 0.25 | 0.52 | 0.22 | 0.97 | 0.97 | |
| Write and Revise Informational Texts | 0.23 | 0.56 | 0.20 | 0.97 | 0.97 | |
| Write and Revise Narratives | 0.24 | 0.56 | 0.20 | 0.97 | 0.97 | |
| Write and Revise Opinion Texts | 0.24 | 0.55 | 0.21 | 0.97 | 0.97 | |
| 5 | Editing | 0.25 | 0.51 | 0.23 | 0.98 | 0.97 |
| Language and Vocabulary Use | 0.26 | 0.50 | 0.24 | 0.97 | 0.98 | |
| Listen/Interpret | 0.24 | 0.54 | 0.22 | 0.97 | 0.97 | |
| Research: Analyze Information | 0.25 | 0.52 | 0.23 | 0.97 | 0.97 | |
| Research: Interpret and Integrate | 0.28 | 0.46 | 0.26 | 0.98 | 0.98 | |
| Research: Use Evidence | 0.25 | 0.53 | 0.22 | 0.97 | 0.97 | |
| Write and Revise Informational Texts | 0.22 | 0.56 | 0.21 | 0.97 | 0.96 | |
| Write and Revise Narratives | 0.26 | 0.50 | 0.24 | 0.98 | 0.98 | |
| Write and Revise Opinion Texts | 0.23 | 0.57 | 0.20 | 0.96 | 0.97 | |
| 6 | Editing | 0.26 | 0.57 | 0.18 | 0.98 | 0.96 |
| Language and Vocabulary Use | 0.29 | 0.52 | 0.20 | 0.98 | 0.97 | |
| Listen/Interpret | 0.31 | 0.47 | 0.22 | 0.98 | 0.98 | |
| Research: Analyze and Integrate Information | 0.29 | 0.49 | 0.22 | 0.98 | 0.95 | |
| Research: Evaluate Information and Sources | 0.30 | 0.48 | 0.22 | 0.98 | 0.97 | |
| Research: Use Evidence | 0.28 | 0.51 | 0.21 | 0.98 | 0.95 | |
| Write and Revise Explanatory Texts | 0.29 | 0.50 | 0.21 | 0.98 | 0.97 | |
| Write and Revise Narratives | 0.29 | 0.49 | 0.21 | 0.98 | 0.97 | |
| 7 | Editing | 0.21 | 0.65 | 0.14 | 0.96 | 0.92 |
| Language and Vocabulary Use | 0.30 | 0.49 | 0.21 | 0.98 | 0.97 | |
| Listen/Interpret | 0.28 | 0.52 | 0.19 | 0.98 | 0.97 | |
| Research: Analyze and Integrate Information | 0.27 | 0.53 | 0.19 | 0.98 | 0.96 | |
| Research: Evaluate Information and Sources | 0.28 | 0.53 | 0.19 | 0.98 | 0.97 | |
| Research: Use Evidence | 0.29 | 0.50 | 0.21 | 0.98 | 0.96 | |
| Write and Revise Argumentative Texts | 0.29 | 0.51 | 0.21 | 0.98 | 0.96 | |
| Write and Revise Explanatory Texts | 0.30 | 0.49 | 0.21 | 0.98 | 0.97 | |
| Write and Revise Narratives | 0.29 | 0.51 | 0.20 | 0.98 | 0.97 | |
| 8 | Editing | 0.32 | 0.46 | 0.22 | 0.98 | 0.98 |
| Language and Vocabulary Use | 0.32 | 0.46 | 0.22 | 0.98 | 0.98 | |
| Listen/Interpret | 0.28 | 0.54 | 0.19 | 0.98 | 0.97 | |
| Research: Analyze and Integrate Information | 0.32 | 0.46 | 0.22 | 0.98 | 0.98 | |
| Research: Evaluate Information and Sources | 0.33 | 0.45 | 0.22 | 0.98 | 0.98 | |
| Research: Use Evidence | 0.31 | 0.46 | 0.23 | 0.98 | 0.98 | |
| Write and Revise Explanatory Texts | 0.32 | 0.44 | 0.24 | 0.99 | 0.98 | |
| Write and Revise Narratives | 0.30 | 0.48 | 0.22 | 0.98 | 0.97 | |
| 11 | Editing | 0.24 | 0.54 | 0.21 | 0.97 | 0.97 |
| Language and Vocabulary Use | 0.30 | 0.45 | 0.25 | 0.98 | 0.98 | |
| Listen/Interpret | 0.26 | 0.52 | 0.22 | 0.97 | 0.98 | |
| Research: Analyze and Integrate Information | 0.29 | 0.46 | 0.25 | 0.98 | 0.98 | |
| Research: Evaluate Information and Sources | 0.27 | 0.49 | 0.24 | 0.98 | 0.98 | |
| Research: Use Evidence | 0.28 | 0.46 | 0.26 | 0.98 | 0.98 | |
| Write and Revise Argumentative Texts | 0.27 | 0.49 | 0.24 | 0.98 | 0.97 | |
| Write and Revise Narratives | 0.29 | 0.45 | 0.26 | 0.98 | 0.98 |
| Grade | Block Name | Prop Assigned Below Standard | Prop Assigned Near Standard | Prop Assigned Above Standard | Prop Correctly Classified Below Standard | Prop Correctly Classified Above Standard |
|---|---|---|---|---|---|---|
| 3 | Four Operations: Interpret, Represent, and Solve | 0.34 | 0.38 | 0.28 | 0.99 | 0.99 |
| Geometry | 0.21 | 0.62 | 0.17 | 0.95 | 0.96 | |
| Linear and Area Measurement | 0.30 | 0.45 | 0.26 | 0.98 | 0.98 | |
| Multiplication and Division: Interpret, Represent, and Solve | 0.33 | 0.40 | 0.27 | 0.98 | 0.99 | |
| Multiply and Divide within 100 | 0.36 | 0.36 | 0.29 | 0.99 | 0.99 | |
| Number and Operations - Fractions | 0.28 | 0.48 | 0.24 | 0.98 | 0.97 | |
| Number and Operations in Base Ten | 0.34 | 0.37 | 0.29 | 0.99 | 0.99 | |
| Properties of Multiplication and Division | 0.28 | 0.48 | 0.24 | 0.98 | 0.97 | |
| Time, Volume, and Mass | 0.34 | 0.37 | 0.29 | 0.99 | 0.99 | |
| 4 | Build Fractions from Unit Fractions | 0.35 | 0.41 | 0.24 | 0.99 | 0.98 |
| Factors and Multiples | 0.32 | 0.48 | 0.20 | 0.98 | 0.97 | |
| Four Operations: Interpret, Represent, and Solve | 0.40 | 0.33 | 0.26 | 0.99 | 0.99 | |
| Fraction Equivalence and Ordering | 0.40 | 0.32 | 0.28 | 0.99 | 0.98 | |
| Fractions and Decimal Notation | 0.32 | 0.46 | 0.22 | 0.99 | 0.97 | |
| Generate and Analyze Patterns | 0.27 | 0.55 | 0.18 | 0.98 | 0.95 | |
| Geometry | 0.22 | 0.64 | 0.15 | 0.98 | 0.89 | |
| Multidigit Arithmetic: Place Value and Operations | 0.34 | 0.44 | 0.22 | 0.99 | 0.97 | |
| Place Value and Multidigit Whole Numbers | 0.33 | 0.44 | 0.22 | 0.99 | 0.97 | |
| 5 | Add and Subtract with Equivalent Fractions | 0.43 | 0.35 | 0.22 | 0.99 | 0.98 |
| Convert Measurements | 0.41 | 0.37 | 0.21 | 0.99 | 0.98 | |
| Geometry | 0.27 | 0.61 | 0.12 | 0.97 | 0.94 | |
| Numerical Expressions | 0.35 | 0.48 | 0.17 | 0.99 | 0.97 | |
| Operations with Whole Numbers and Decimals | 0.38 | 0.43 | 0.19 | 0.99 | 0.98 | |
| Place Value System | 0.39 | 0.42 | 0.19 | 0.99 | 0.97 | |
| Volume Concepts | 0.38 | 0.42 | 0.20 | 0.99 | 0.97 | |
| 6 | Algebraic Expressions | 0.38 | 0.43 | 0.19 | 0.99 | 0.96 |
| Dependent and Independent Variables | 0.41 | 0.41 | 0.18 | 0.99 | 0.97 | |
| Divide Fractions by Fractions | 0.42 | 0.38 | 0.19 | 0.99 | 0.98 | |
| Geometry | 0.41 | 0.37 | 0.22 | 0.99 | 0.96 | |
| Multidigit Numbers, Factors, and Multiples | 0.41 | 0.40 | 0.20 | 0.99 | 0.97 | |
| One-Variable Expressions and Equations | 0.43 | 0.36 | 0.21 | 0.99 | 0.98 | |
| Rational Number System II | 0.36 | 0.46 | 0.18 | 0.99 | 0.95 | |
| Ratios and Proportional Relationships | 0.43 | 0.37 | 0.20 | 0.99 | 0.98 | |
| Statistics and Probability | 0.26 | 0.62 | 0.12 | 0.98 | 0.90 | |
| 7 | Algebraic Expressions and Equations | 0.39 | 0.39 | 0.22 | 0.99 | 0.98 |
| Angles, Areas, and Volume | 0.35 | 0.43 | 0.22 | 0.99 | 0.95 | |
| Equivalent Expressions | 0.36 | 0.43 | 0.21 | 0.99 | 0.96 | |
| Geometric Figures | 0.39 | 0.37 | 0.23 | 0.99 | 0.97 | |
| Ratios and Proportional Relationships | 0.35 | 0.44 | 0.21 | 0.99 | 0.96 | |
| Statistics and Probability | 0.34 | 0.47 | 0.19 | 0.99 | 0.95 | |
| The Number System | 0.36 | 0.44 | 0.20 | 0.99 | 0.97 | |
| 8 | Analyze and Solve Linear Equations | 0.39 | 0.39 | 0.22 | 0.99 | 0.96 |
| Congruence and Similarity | 0.34 | 0.48 | 0.18 | 0.99 | 0.96 | |
| Expressions and Equations II | 0.36 | 0.44 | 0.20 | 0.99 | 0.97 | |
| Functions | 0.39 | 0.41 | 0.21 | 0.99 | 0.97 | |
| Proportional Relationships, Lines, and Linear Equations | 0.36 | 0.43 | 0.21 | 0.99 | 0.95 | |
| The Number System | 0.33 | 0.50 | 0.17 | 0.99 | 0.96 | |
| Volume of Cylinders, Cones, and Spheres | 0.30 | 0.51 | 0.20 | 0.99 | 0.85 | |
| 11 | Create Equations: Linear and Exponential | 0.43 | 0.38 | 0.19 | 0.99 | 0.97 |
| Create Equations: Quadratic | 0.38 | 0.44 | 0.19 | 0.99 | 0.93 | |
| Equations and Reasoning | 0.43 | 0.38 | 0.19 | 0.99 | 0.97 | |
| Geometry and Right Triangle Trigonometry | 0.41 | 0.39 | 0.20 | 0.99 | 0.95 | |
| Interpreting Functions | 0.36 | 0.48 | 0.16 | 0.99 | 0.94 | |
| Number and Quantity | 0.34 | 0.52 | 0.14 | 0.99 | 0.94 | |
| Seeing Structure in Expressions/Polynomial Expressions | 0.41 | 0.43 | 0.17 | 0.99 | 0.97 | |
| Solve Equations and Inequalities: Linear and Exponential | 0.45 | 0.34 | 0.20 | 0.99 | 0.98 | |
| Solve Equations and Inequalities: Quadratic | 0.40 | 0.38 | 0.21 | 0.99 | 0.91 | |
| Statistics and Probability | 0.27 | 0.62 | 0.11 | 0.97 | 0.93 |
Table 2.9 and Table 2.10 show the accuracy of the ICAs for classifying students into achievement levels (L1 to L4) based on students’ overall test performance. Each table shows the proportion of students assigned to each achievement level as well as the proportion who were correctly classified. For example, a proportion of 0.24, or 24%, of students for the grade 3 ELA/literacy ICA were assigned to achievement level 1 (L1). Of these, a proportion of 0.86, or 86%, were truly at achievement level 1 based on the true \(\theta\). Classifications tended to be more accurate for levels 1 and 4 than for levels 2 and 3.
| Grade | Prop Assigned L1 | Prop Assigned L2 | Prop Assigned L3 | Prop Assigned L4 | Prop Correctly Classified L1 | Prop Correctly Classified L2 | Prop Correctly Classified L3 | Prop Correctly Classified L4 | Overall | kappa |
|---|---|---|---|---|---|---|---|---|---|---|
| 3 | 0.24 | 0.27 | 0.24 | 0.25 | 0.86 | 0.73 | 0.67 | 0.87 | 0.78 | 0.91 |
| 4 | 0.28 | 0.23 | 0.24 | 0.25 | 0.87 | 0.68 | 0.67 | 0.84 | 0.77 | 0.91 |
| 5 | 0.27 | 0.23 | 0.29 | 0.20 | 0.88 | 0.69 | 0.76 | 0.85 | 0.80 | 0.91 |
| 6 | 0.28 | 0.27 | 0.28 | 0.17 | 0.88 | 0.74 | 0.76 | 0.83 | 0.80 | 0.91 |
| 7 | 0.29 | 0.25 | 0.29 | 0.16 | 0.89 | 0.71 | 0.78 | 0.83 | 0.80 | 0.91 |
| 8 | 0.28 | 0.26 | 0.29 | 0.16 | 0.90 | 0.76 | 0.79 | 0.84 | 0.82 | 0.92 |
| 9 | 0.23 | 0.24 | 0.30 | 0.24 | 0.88 | 0.72 | 0.78 | 0.85 | 0.80 | 0.92 |
| 10 | 0.23 | 0.25 | 0.29 | 0.22 | 0.87 | 0.74 | 0.78 | 0.84 | 0.80 | 0.91 |
| 11 | 0.24 | 0.26 | 0.28 | 0.21 | 0.88 | 0.75 | 0.77 | 0.84 | 0.80 | 0.91 |
| Grade | Prop Assigned L1 | Prop Assigned L2 | Prop Assigned L3 | Prop Assigned L4 | Prop Correctly Classified L1 | Prop Correctly Classified L2 | Prop Correctly Classified L3 | Prop Correctly Classified L4 | Overall | kappa |
|---|---|---|---|---|---|---|---|---|---|---|
| 3 | 0.29 | 0.24 | 0.26 | 0.21 | 0.88 | 0.75 | 0.78 | 0.87 | 0.82 | 0.93 |
| 4 | 0.26 | 0.30 | 0.24 | 0.20 | 0.87 | 0.79 | 0.74 | 0.86 | 0.81 | 0.92 |
| 5 | 0.32 | 0.29 | 0.18 | 0.21 | 0.88 | 0.75 | 0.64 | 0.87 | 0.80 | 0.92 |
| 6 | 0.33 | 0.30 | 0.18 | 0.19 | 0.89 | 0.76 | 0.73 | 0.89 | 0.82 | 0.93 |
| 7 | 0.31 | 0.29 | 0.21 | 0.19 | 0.88 | 0.77 | 0.74 | 0.88 | 0.82 | 0.92 |
| 8 | 0.33 | 0.27 | 0.19 | 0.20 | 0.88 | 0.75 | 0.70 | 0.86 | 0.80 | 0.92 |
| 9 | 0.30 | 0.26 | 0.21 | 0.23 | 0.86 | 0.71 | 0.70 | 0.88 | 0.79 | 0.92 |
| 10 | 0.35 | 0.25 | 0.22 | 0.18 | 0.89 | 0.70 | 0.73 | 0.85 | 0.80 | 0.92 |
| 11 | 0.38 | 0.27 | 0.22 | 0.14 | 0.88 | 0.69 | 0.74 | 0.85 | 0.80 | 0.91 |
Table 2.11 and Table 2.12 show the classification accuracy for ICA claim scores. These tables show the proportion of students assigned to each category of achievement with respect to the level 3 cut score (standard)—below, near, or above—and for each of the “above” and “below” categories, the proportion of those assigned to that category whose thetas were truly above or below the standard. Classification accuracy was high.
| Claim | Grade | Prop Assigned Below | Prop Assigned Near | Prop Assigned Above | Prop Correctly Classified Below | Prop Correctly Classified Above |
|---|---|---|---|---|---|---|
| 1 | 3 | 0.28 | 0.48 | 0.25 | 0.98 | 0.98 |
| 4 | 0.30 | 0.45 | 0.25 | 0.98 | 0.98 | |
| 5 | 0.29 | 0.44 | 0.27 | 0.98 | 0.98 | |
| 6 | 0.31 | 0.47 | 0.22 | 0.98 | 0.98 | |
| 7 | 0.34 | 0.42 | 0.24 | 0.99 | 0.98 | |
| 8 | 0.36 | 0.38 | 0.27 | 0.99 | 0.98 | |
| 9 | 0.28 | 0.40 | 0.32 | 0.99 | 0.98 | |
| 10 | 0.30 | 0.40 | 0.30 | 0.99 | 0.98 | |
| 11 | 0.32 | 0.40 | 0.29 | 0.99 | 0.99 | |
| 2 | 3 | 0.27 | 0.49 | 0.24 | 0.98 | 0.98 |
| 4 | 0.25 | 0.53 | 0.22 | 0.97 | 0.97 | |
| 5 | 0.25 | 0.52 | 0.23 | 0.97 | 0.97 | |
| 6 | 0.31 | 0.47 | 0.22 | 0.98 | 0.98 | |
| 7 | 0.32 | 0.46 | 0.22 | 0.98 | 0.98 | |
| 8 | 0.31 | 0.47 | 0.22 | 0.98 | 0.98 | |
| 9 | 0.23 | 0.51 | 0.25 | 0.97 | 0.98 | |
| 10 | 0.25 | 0.51 | 0.24 | 0.97 | 0.98 | |
| 11 | 0.26 | 0.52 | 0.22 | 0.97 | 0.98 | |
| 3 | 3 | 0.21 | 0.60 | 0.19 | 0.96 | 0.96 |
| 4 | 0.18 | 0.66 | 0.16 | 0.95 | 0.94 | |
| 5 | 0.21 | 0.60 | 0.19 | 0.96 | 0.96 | |
| 6 | 0.24 | 0.58 | 0.17 | 0.97 | 0.95 | |
| 7 | 0.22 | 0.63 | 0.15 | 0.96 | 0.94 | |
| 8 | 0.20 | 0.66 | 0.14 | 0.93 | 0.95 | |
| 9 | 0.20 | 0.59 | 0.21 | 0.96 | 0.97 | |
| 10 | 0.21 | 0.59 | 0.20 | 0.96 | 0.97 | |
| 11 | 0.22 | 0.60 | 0.18 | 0.96 | 0.97 | |
| 4 | 3 | 0.22 | 0.58 | 0.20 | 0.97 | 0.96 |
| 4 | 0.23 | 0.57 | 0.20 | 0.97 | 0.96 | |
| 5 | 0.26 | 0.51 | 0.24 | 0.98 | 0.97 | |
| 6 | 0.29 | 0.51 | 0.21 | 0.98 | 0.97 | |
| 7 | 0.25 | 0.58 | 0.18 | 0.98 | 0.94 | |
| 8 | 0.31 | 0.47 | 0.22 | 0.98 | 0.98 | |
| 9 | 0.22 | 0.54 | 0.24 | 0.97 | 0.97 | |
| 10 | 0.23 | 0.54 | 0.22 | 0.97 | 0.97 | |
| 11 | 0.25 | 0.54 | 0.21 | 0.97 | 0.97 |
| Claim | Grade | Prop Assigned Below | Prop Assigned Near | Prop Assigned Above | Prop Correctly Classified Below | Prop Correctly Classified Above |
|---|---|---|---|---|---|---|
| 1 | 3 | 0.36 | 0.34 | 0.29 | 0.99 | 0.99 |
| 4 | 0.41 | 0.33 | 0.26 | 0.99 | 0.99 | |
| 5 | 0.42 | 0.37 | 0.21 | 0.99 | 0.98 | |
| 6 | 0.45 | 0.33 | 0.22 | 0.99 | 0.98 | |
| 7 | 0.42 | 0.34 | 0.24 | 0.99 | 0.98 | |
| 8 | 0.44 | 0.33 | 0.23 | 0.99 | 0.98 | |
| 9 | 0.38 | 0.35 | 0.27 | 0.99 | 0.99 | |
| 10 | 0.42 | 0.34 | 0.24 | 0.99 | 0.99 | |
| 11 | 0.44 | 0.38 | 0.19 | 0.99 | 0.98 | |
| 2&4 | 3 | 0.29 | 0.44 | 0.27 | 0.99 | 0.95 |
| 4 | 0.32 | 0.45 | 0.23 | 0.99 | 0.96 | |
| 5 | 0.35 | 0.45 | 0.19 | 0.99 | 0.95 | |
| 6 | 0.37 | 0.43 | 0.20 | 0.99 | 0.93 | |
| 7 | 0.38 | 0.38 | 0.24 | 0.99 | 0.96 | |
| 8 | 0.35 | 0.46 | 0.18 | 0.99 | 0.97 | |
| 9 | 0.27 | 0.54 | 0.20 | 0.98 | 0.95 | |
| 10 | 0.30 | 0.52 | 0.17 | 0.98 | 0.95 | |
| 11 | 0.36 | 0.48 | 0.16 | 0.99 | 0.95 | |
| 3 | 3 | 0.29 | 0.45 | 0.25 | 0.98 | 0.97 |
| 4 | 0.24 | 0.59 | 0.17 | 0.98 | 0.92 | |
| 5 | 0.31 | 0.53 | 0.15 | 0.98 | 0.96 | |
| 6 | 0.36 | 0.46 | 0.18 | 0.99 | 0.94 | |
| 7 | 0.31 | 0.52 | 0.17 | 0.98 | 0.95 | |
| 8 | 0.31 | 0.53 | 0.16 | 0.98 | 0.94 | |
| 9 | 0.27 | 0.52 | 0.20 | 0.98 | 0.93 | |
| 10 | 0.31 | 0.51 | 0.18 | 0.99 | 0.93 | |
| 11 | 0.34 | 0.51 | 0.15 | 0.99 | 0.91 |