Chapter 4 Test Design
4.1 Introduction
The intent of this chapter is to show how the assessment design supports the purposes of Smarter Balanced assessments. Test design entails developing a test philosophy (i.e., Theory of Action); identifying test purposes; and determining the targeted examinee populations, test specifications, item pool design, and other features such as test delivery (Schmeiser & Welch, 2006). The Smarter Balanced Theory of Action, test purposes, and the targeted examinee population were outlined in the Overview and Chapter 1 of this report.
4.2 Content Structure
In developing and maintaining a system of assessments, the goal of Smarter Balanced is to ensure that the assessment’s measurement properties reflect industry standards for content, rigor, and performance. A key step in this direction is to ensure that the Smarter Balanced assessments are aligned with the Common Core State Standards (CCSS). Figure 4.1 briefly encapsulates the Smarter Balanced content structure.
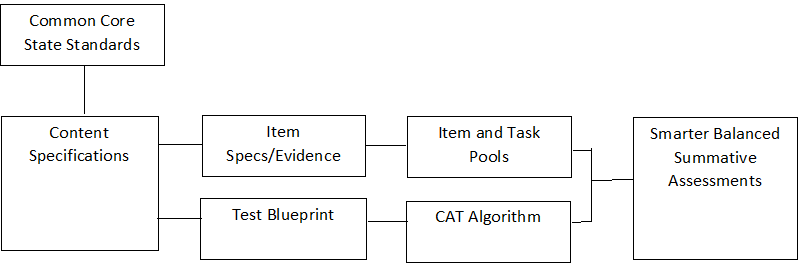
Figure 4.1: Components of Smarter Balanced Test Design
The Common Core State Standards are the content standards in English language arts/literacy (ELA/literacy) and mathematics that many states have adopted. Because the CCSS were not specifically developed for assessment, they contain extensive rationale and information concerning instruction. Therefore, adopting previous practices used by many state programs, Smarter Balanced content experts produced content specifications in ELA/literacy and mathematics that distill assessment-focused elements from the CCSS (Smarter Balanced, 2017a, b). Item development specifications (https://portal.smarterbalanced.org/library-home/) are then based on content specifications. Each item is aligned to a specific claim and target and to a Common Core State Standard.
Within each of the two subject areas in grades 3 to 8 and high school, there are four broad claims. Within each claim, there are a number of assessment targets. The claims in ELA/literacy and mathematics are given in Table 4.1.
| Claim | ELA/Literacy | Mathematics |
|---|---|---|
| 1 | Reading | Concepts and Procedures |
| 2 | Writing | Problem-Solving |
| 3 | Speaking/Listening | Communicating Reasoning |
| 4 | Research | Modeling and Data Analysis |
Currently, only the listening part of ELA/literacy claim 3 is assessed. In mathematics, claims 2 and 4 are reported together as a single subscore, so there are only three reporting categories for mathematics, but four claims.
Because of the breadth in coverage of the individual claims, targets within each claim were needed to define more specific performance expectations. The relationship between targets and Common Core State Standards elements is made explicit in the Smarter Balanced content specifications (2017a, b).
The Smarter Balanced item and task specifications (Smarter Balanced Assessment Consortium, 2015c) are comprised of many documents, all of which are based on Smarter Balanced content specifications. These documents provide guidance on how to translate the Smarter Balanced content specifications into actual assessment items. In addition, guidelines for bias and sensitivity (Smarter Balanced Assessment Consortium, 2012c), accessibility and accommodations (Smarter Balanced Assessment Consortium, 2016c, 2017c), and style (Smarter Balanced Assessment Consortium, 2015a) help item developers and reviewers ensure consistency and fairness across the item bank. The specifications and guidelines were reviewed by member states, school districts, higher education representatives, and other stakeholders. The item specifications describe the evidence to be elicited and provide sample task models to guide the development of items that measure student performance relative to the target.
The Smarter Balanced ELA/Literacy Summative Assessment Blueprint (2018d) and Mathematics Summative Assessment Blueprint (2018e) describe the content of the English language arts/literacy and math summative assessments for grades 3 to 8 and high school administered in 2018-19 and how that content will be assessed. The blueprints also describe the composition of the two assessment components, computer adaptive test (CAT) and performance task (PT). For the computer adaptive component, specific items administered to each student are uniquely determined based on an item-selection algorithm that includes content constraints that correspond to the test blueprint. The performance tasks (PTs) act in concert with the computer adaptive test (CAT) items to fulfill the blueprint. Developed with broad input from member states, partners, and stakeholders, the summative test blueprints reflect the depth and breadth of the performance expectations of the CCSS. Smarter Balanced governing members adopted the preliminary test blueprints in 2012. The summative test blueprints developed subsequently contain refinements and revisions based on the analyses of pilot tests, field tests, and operational tests.
4.3 Synopsis of Assessment System Components
The summative assessment for each content area consists of two parts: a computer adaptive test (CAT) and a performance task (PT). The PT is administered on a computer but is not computer adaptive. The summative assessment is administered according to the guidance provided in the Smarter Balanced Online Summative Test Administration Manual (2017i). The summative assessment scores
- accurately describe student achievement and can describe growth of student learning as part of program evaluation and school, district, and state accountability systems;
- provide valid, reliable, and fair measures of students’ progress toward, and attainment of, the knowledge and skills required to be college and career ready;
- measure the breadth and depth of the CCSS across the full spectrum of student ability by incorporating a variety of item types (including items and tasks scored by expert raters) that are supported by a comprehensive set of accessibility resources;
- capitalize on the strengths of computer adaptive testing—efficient and precise measurement across the full range of student achievement; and
- utilize performance tasks to provide a measure of the student’s ability to integrate knowledge and skills.
4.4 Evidence-Centered Design in Constructing Smarter Balanced Assessments
Evidence-centered design (ECD) is an approach to the creation of educational assessments in terms of reasoning about evidence (arguments) concerning the intended constructs. The ECD begins with identification of claims or inferences users want to make concerning student achievement. Evidence needed to support those claims is then specified, and finally, items/tasks capable of eliciting that information are designed (Mislevy, Steinberg, & Almond, 2003). Explicit attention is paid to the potential influence of unintended constructs. ECD accomplishes this in two ways. The first is by incorporating an overarching concept of assessment as an argument from imperfect evidence. This argument makes explicit the claims (the inferences that one intends to make based on scores) and the nature of the evidence that supports those claims (Hansen & Mislevy, 2008; Mislevy & Haertel, 2006). The second is by distinguishing the activities and structures involved in the assessment enterprise in order to exemplify an assessment argument in operational processes. By making the underlying evidentiary argument more explicit, the framework makes operational elements more amenable to examination, sharing, and refinement. Making the argument more explicit also helps designers meet diverse assessment needs caused by changing technological, social, and legal environments (Hansen & Mislevy, 2008; Zhang, Haertel, Javitz, Mislevy, Murray, & Wasson, 2009). The ECD process entails five types of activities, or layers, of assessment. The activities focus on 1) the identification of the substantive domain to be assessed; 2) the assessment argument; 3) the structure of assessment elements such as tasks, rubrics, and psychometric models; 4) the implementation of these elements; and 5) the way they function in an operational assessment, as described below.
- Domain Analysis. In this first layer, domain analysis involves determining the specific content to be included in the assessment. Smarter Balanced uses the Common Core State Standards as its content domain for mathematics and ELA/literacy. Domain analysis was conducted by the developers of the CCSS, who first developed college and career readiness standards, to address what students are expected to know and be able to do by the time they graduate from high school. This was followed by development of the K–12 standards, which address expectations for students in elementary through high school.
- Domain Modeling. In domain modeling, a high-level description of the overall components of the assessment is created and documented. For Smarter Balanced, the components include computer-adaptive summative and interim assessments in mathematics and ELA/literacy. The domain framework was developed by organizing the CCSS into domain areas that form the structure of test blueprints and reporting categories. This overall structure was created in the course of Smarter Balanced content specification development.
- The Conceptual Assessment Framework. Next, the conceptual assessment framework is developed. For Smarter Balanced, this step was accomplished in developing the Smarter Balanced content specifications, which identify major claim structure, targets within claims, and the relationship of those elements to underlying content of the CCSS. In this step, the knowledge, skills, and abilities to be assessed (i.e., intended constructs, targets of assessment); the evidence that needs to be collected; and the features of the tasks that will elicit the evidence are specified in detail. Ancillary constructs that may be required to respond correctly to an assessment task but are not the intended target of the assessment are also specified (e.g., reading skills in a mathematics examination). By identifying any ancillary knowledge, skills, and abilities (KSAs), construct-irrelevant variance can be identified a priori and minimized during item and task development. Potential barriers created by the ancillary KSAs can be removed or their effects minimized through the provision of appropriate access features. The item and task specifications describe the evidence required to support claims about the assessment targets and also identify any ancillary constructs.
- Implementation. This layer involves the development of the assessment items or tasks using the specifications created in the conceptual assessment framework just described. In addition, scoring rubrics are created, and the scoring process is specified. Smarter Balanced items, performance tasks, and associated scoring rubrics were developed starting in the spring of 2012.
- Delivery. In this final layer, the processes for administration and reporting are created. The delivery system describes the adaptive algorithm, collection of student evidence, task assembly, and presentation models required for the assessment and how they function together. The ECD elements chosen lead to the best evaluation of the construct for the intended test purposes. Test delivery and test scoring are discussed below.
4.5 Test Blueprints
Test specifications and blueprints define the knowledge, skills, and abilities intended to be measured on each student’s test event. A blueprint also specifies how skills are sampled from a set of content standards (i.e., the CCSS). Other important factors, such as depth of knowledge (DOK), are also specified. Specifically, a test blueprint is a formal document that guides the development and assembly of an assessment by explicating the following types of essential information:
- Content (claims and assessment targets) that is included for each assessed subject and grade, across various levels of the system (student, classroom, school, district, state)
- The relative emphasis of content standards generally indicated as the number of items or percentage of points per claim and assessment target
- The depth of knowledge (DOK) required by test items, indicating the complexity of item types for each claim and assessment target
The test blueprint is an essential guide for both assessment developers and curriculum and instruction. For assessment developers, the blueprint and related test-specification documents define how the test will ensure coverage of the full breadth and depth of content and how it will maintain fidelity to the intent of the CCSS on which the Smarter Balanced assessment is based. Full content alignment is necessary in order to ensure that educational stakeholders can make valid, reliable, and unbiased inferences about student, classroom, school, and state performance. At the instructional level, the test blueprint provides a guide to the relative importance of competing content demands and suggests how the content is demonstrated, as indicated by depth of knowledge, which is associated with item type. In summary, an assessment blueprint provides clear development specifications and signals to the broader education community both the full complexity of the CCSS and how performance on these standards is substantiated.
Part of the innovative aspect of the Smarter Balanced assessments is that the test blueprints sample the content domain using both a computer adaptive component (CAT) and a performance task (PT). The test blueprints can be inspected to determine the contribution of the CAT and PT components in a grade and content area toward the construct intended to be measured. Another aspect of the assessments is the provision of a variety of both machine-scored and human-scored items and response types. The contribution of these scoring mechanisms and response types is specified in the Smarter Balanced test blueprints.
In February 2015, the governing members of the Smarter Balanced Assessment Consortium adopted blueprints for the summative assessments of mathematics and ELA/literacy for grades 3 to 8 and high school (Smarter Balanced Assessment Consortium, 2016f,g). These were fully implemented in the 2014–15 school year and were in effect in the 2018-19 school year. The blueprints were subsequently modified beginning with the 2018-19 administration (Smarter Balanced, 2018d,e).
The summative assessment is composed of the CAT and PT components. Responses from both components are combined to cover the test blueprint in a grade and content area and are used to produce the overall and claim scale scores. Figure 4.2 is a conceptual diagram of how claims are distributed across the adaptive and performance task parts of the tests.
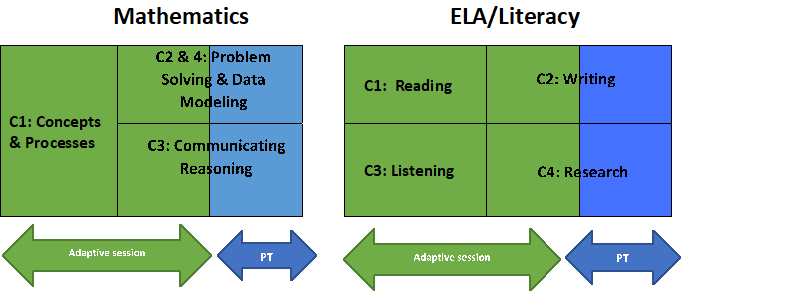
Figure 4.2: Claim Distribution in Test Blueprints
4.6 Operational Summative Assessment Blueprints and Specifications
For each designated grade range (3 to 5, 6 to 8, and high school), the test blueprints present specifications for numbers of items by claim score/reporting category, content category, type of stimuli, CAT component, and performance task (PT). Details are given separately for each grade and include claim, assessment target, DOK, assessment type (CAT/PT), and the total number of items (Smarter Balanced, 2016f; Smarter Balanced, 2016g). Assessment targets are nested within claims and represent a more detailed specification of content. In addition to the nested hierarchical structure, each blueprint also specifies a number of rules applied at global or claim levels. Most of these specifications are in the footnotes, which constitute important parts of the test designs. Current blueprints for the summative assessment are available here:
https://portal.smarterbalanced.org/library/mathematics-summative-assessment-blueprint/
https://portal.smarterbalanced.org/library/elaliteracy-summative-assessment-blueprint/
The CAT algorithm selects items necessary to conform to the test blueprint and, at the same time, meet requirements for measurement precision. In establishing requirements for content and measurement precision in the CAT component, designers took advantage of the adaptive pool to allow more variety than would be present in a fixed-form test. For example, when the number of content targets in a domain area is large, blueprints allow choice within target clusters rather than limiting the number of targets. Since all content targets are represented in the pool, any student can potentially get any target while the full set of content constraints is still maintained.
4.7 CAT and Performance Task Test Components
Part of the Smarter Balanced Theory of Action is to leverage appropriate technology and innovation. The use of CAT methodologies helps ensure that students across the range of proficiency have an assessment experience with items well targeted to their skill level. Adaptive testing allows average-, very low-, and very high-performing students to stay engaged in the assessment because they respond to items specifically targeted to their skill level. Non-adaptive performance tasks measure a student’s ability to integrate knowledge and skills across multiple standards. No order is imposed on the components; a student may take either the CAT or PT portion of the test first.
CAT tests are more efficient in that they provide a higher level of score precision than fixed-form tests with the same number of items. For the CAT component, there are both content constraints (e.g., a long reading passage in ELA/literacy must be administered) and psychometric criteria that must be optimized for each student. Performance tasks are intended to measure multiple standards in a coherent task that requires use of integrated skill sets. Performance tasks measure capacities such as essay writing, research skills, and complex analysis, which are not as easy to assess with individual, discrete items.
4.8 Content Alignment
Content alignment addresses how well individual test items, test blueprints, and the tests themselves represent the intended construct and support appropriate inferences. With a computer adaptive test, a student’s test form is a sampling of items drawn from a much larger universe of possible items and tasks. The sampling is guided by a blueprint. Alignment studies investigate how well individual tests cover the intended breadth and depth of the underlying content standards. For inferences from test results to be justifiable, the sample of items in each student’s test has to be an adequate representation of the broad domain, providing strong evidence to support claims being made from the test results.
Four alignment studies have been conducted to examine the alignment between Smarter Balanced tests and the CCSS. The Human Resources Research Organization (HumRRO, 2016) conducted the first alignment study. HumRRO’s comprehensive study centered around the assumptions of evidence-centered design (ECD), which examined the connections in the evidentiary chain underlying the development of the Smarter Balanced foundational documents (test blueprints, content specifications, and item/task specifications) and the resulting summative assessments. Among those connections was the alignment between the Smarter Balanced content specifications, the alignment between the Smarter Balanced evidence statements and content specifications, and the alignment between the Smarter Balanced blueprint and the Smarter Balanced content specifications. Results from this study were favorable in terms of the intended breadth and depth of the alignment for each connection in the evidentiary chain.
In 2016, the Fordham Institute and HumRRO investigated the quality of the Smarter Balanced assessments relative to Council of Chief State School Officers (CCSSO) criteria for evaluating high-equality assessments. In particular, the Smarter Balanced assessments were investigated to see if they placed strong emphasis on the most important content for college and career readiness and if they required that students demonstrate the range of thinking skills called for by those standards. Fordham Institute reviewed grades 5 and 8 ELA and mathematics, and HumRRO reviewed high school ELA and mathematics.
- Fordham Institute (2017) rated Smarter Balanced grades 5 and 8 ELA assessments an excellent match to the CCSSO criteria for content in ELA, and a good match for depth in ELA.
- Fordham Institute rated Smarter Balanced grades 5 and 8 mathematics assessments as a good match to the CCSSO criteria for content in mathematics, and a good match to the CCSSO criteria for depth in mathematics.
- HumRRO (2017) rated the Smarter Balanced high school ELA assessments an excellent match to the CCSSO criteria for content in ELA, and a good to excellent match for depth in ELA.
- HumRRO (2017) rated the Smarter Balanced high school ELA assessments a good to excellent match to the CCSSO criteria for content in ELA, and a good to excellent match for depth in ELA.
An additional external alignment study, completed by WestEd (2017), employed a modified Webb alignment methodology to examine the summative assessments for grades 3, 4, 6, and 7 using sample test events built using 2015–16 operational data. The WestEd alignment study provided evidence that the items within ELA/literacy and mathematics test events for grades 3, 4, 6, and 7 were well aligned to the CCSS in terms of both content and cognitive complexity.
4.9 Adaptive Test Design and Algorithm
This section describes the method used in the Smarter Balanced system to satisfy the blueprint and provide optimal precision. The implementation described here is released under the Creative Commons Attribution Only, No Derivatives license. This document is a summary with supplemental explanations and examples of explicit functionality found in the separate Smarter Balanced Adaptive Item Selection Algorithm Design Report by Jon Cohen and Larry Albright (2014). Interested readers can refer to the more detailed document for more technical information and specific formulas the algorithm employs.
For the operational test, an item-level, fully adaptive CAT component is administered in ELA/literacy and mathematics. The adaptive part delivers blueprints in a manner that efficiently minimizes measurement error and maximizes information. To assert that test results are comparable across the Consortium, members must adopt an algorithm that delivers the published blueprint. Three potential scenarios through which this could be accomplished are listed below:
- Members may deliver Smarter Balanced assessments using the open-source software for both the test delivery system and adaptive algorithm.
- Members may use the open-source software for one component and a service provider solution for the other (e.g., open-source test delivery system and a vendor’s algorithm that can be appropriately configured).
- Members may use service provider solutions for both components.
Members who use service providers for one or both components may have to respond independently to federal peer review requirements concerning test characteristics that depend on the test delivery platform, including algorithms for item selection and blueprint fulfillment.
Automated test assembly for a CAT depends on a number of factors to produce optimal tests. These depend on the quality of the item bank, reasonableness of the test constraints and precision targets, and the degree to which content or other qualitative attributes of items are salient and can be defined as constraints.
In general, an adaptive algorithm is a method used to carry out a blueprint design by acting on an item pool. The algorithm finds the items expected to compose the best test for each student, selecting items from the pool that match blueprint demands while using information from a student’s responses to find the most accurate score. The blueprint describes in detail the content and other attributes for each student’s test. Both the algorithm and items in the pool must support blueprints in order to deliver accurate, efficient tests.
4.10 Item Attributes
Item attributes that are specified in blueprints and are needed to run the algorithm include, but are not limited to, 1) depth of knowledge, 2) response type, 3) scoring type, 4) common stimulus membership, and 5) mathematical domain. Complete information about these elements must be available to algorithm software for all items. The minimum and maximum number of items in each element are specified in the adaptive software, serving as a constraint to balance aspects such as blueprint coverage with test length. Each element can be given weights to guide the item selection process in an optimal fashion. By allowing for the specification of weights, the general algorithm can be customized for varying conditions of population and pool distribution. For example, weights can be shifted to emphasize measurement precision or content coverage, depending on policy priorities. Final weights are established during the last stages of test design when all item parameters are known and simulation results are available.
In addition to the blueprint attributes listed above, each item has a set of parameters that provide measurement information. The purpose of the algorithm is to satisfy the content blueprint while providing the most accurate student score in the most efficient manner. In measurement terms, the most information is obtained when the item’s difficulty is close to the student’s performance level. At the beginning of the test, item difficulty and discriminating power are known, and student ability is unknown. The algorithm’s job is to determine the student’s ability in the content area being assessed by comparing the student’s performance to the known statistical attributes of the items.
4.11 Test Operation Walkthrough
4.11.1 Preparation
The test delivery system must have in place a sufficient item pool with the full set of parameters and metadata. Smarter Balanced pools contain all items for the intended grade level and items from adjacent grades that address on-grade content. Items from upper grades address content the student has had an opportunity to learn. Items from lower grades are screened for age-appropriateness. Initially, the pool is filtered to include only items that were assigned to the examinee’s grade. Under certain circumstances (described below), the filter is dropped and items assigned to an adjacent grade (higher or lower, depending on the student’s performance) are added if the content they represent is also appropriate for the examinee’s grade. The adaptive engine needs to be populated with all hierarchical and content elements, including the minimum and maximum number of items allowed for each facet of the blueprint.
4.11.2 Initialization
Adaptive tests require methods for avoiding overuse of items. In the 2014–15 summative tests, the algorithm was configured to randomly choose each test’s initial item from the pool. The initial claim is chosen at random as long as passages and hand-scored items are not presented first. The algorithm then cycles through the claims. This strategy is still in use as of the 2018-19 assessment.
4.11.3 Item Selection
The initialization and selection processes attempt to avoid underuse and overuse of items to control item exposure. Exposure control enhances item security and discourages copying and cheating by presenting a variety of items. It also leads to more efficient pool use, assuring that all items developed to cover the content are used. Rather than choosing the single best item for initialization and selection, which would cause some items to be used repeatedly and others rarely or never, the algorithm selects randomly from targeted sets of items. To prevent overuse of highly discriminating items, the discrimination parameter (also called the a-parameter) is not taken into account in selection ranking. The optimal size of the first content-based set and the subsequent subset, which takes information into account, was determined through simulation with actual pool parameters.
Once the student’s response to the first item is scored, the selection process is launched and will be repeated for every subsequent response. The software uses the set of weights described earlier to determine a group of items with the best match to the blueprint, excluding items from target groups that have reached the maximum number of items specified in the blueprint and items previously seen by the examinee. When this mini pool (subset of items) has been chosen, the information value is calculated for each item using the current student ability estimate and known item parameters. Overall item value is calculated using both information and content data. The item set is then sorted according to overall value, and a set of the most preferred items are identified. The item to be administered is chosen randomly from within this set. After each response to a machine-scored item is scored, the student ability estimate is updated. The selection procedure is then repeated until the blueprint has been satisfied.
4.11.4 Expanded Pool Items
The algorithm proceeds in this manner until a percentage of the test (coverage in mathematics, 61%; ELA/literacy, 62%) has been administered, sampling items from all claim areas. At this point, the distance of the estimated score from the level 3 cut score is evaluated. If the student is either above or below the level 3 cut score with probability p<.000001, the item pool is expanded to include items from no more than two adjacent grades in the direction of the difference. These items are called “expanded pool” items.
In grade 3, the pool is expanded only for students above the level 3 cut score and includes items from adjacent upper grades only; in grade 11 the pool is expanded only for students below the level 3 cut score and includes items from adjacent lower grades only. Items from adjacent grades have been screened for appropriateness by content experts to ensure that they represent the content of the target grade. For the remainder of the test, items from the expanded pool and items from the regular pool can be administered. The item with the best content and measurement characteristics is chosen from the pool.
4.11.5 Item Review
Early in the development process, Consortium members determined that students should be allowed to go back to earlier questions, review their answers, and revise their answers if necessary. Students can go back and change their answers within a test segment. When this occurs for machine-scored items, the ongoing student score estimate is updated with the new response. This has implications for test design and delivery. If a student takes a test over the course of two or more days, answers from previous days cannot be changed. In mathematics at grades 6 and higher, some items permit the use of a calculator, while others forbid calculator use. Mathematics tests for grade 6 and higher are consequently divided into two segments: one for non-calculator items and one that permits calculator use. Students can change answers within sections but not across different test sections.
Note that the ELA blueprints for grade 6 and higher in 2018-19 call for the administration of hand-scored items during the adaptive part of the test. The blueprints specify that these items may be AI scored with an application that yields comparable results by meeting or exceeding reliability and validity criteria for hand scoring. The decision to use AI scoring is left to member states. Items requiring hand scoring or AI scoring are chosen based on their information value just like machine-scored items. However, the adaptive engine is designed to work asynchronously from hand scoring. Because the response to the item is not immediately scored, the adaptive engine proceeds using the most recent estimate of student ability and selects the next item accordingly.
4.11.6 Termination
The test ends when the blueprint has been met. At that point, student machine-scored responses are retained.
4.11.7 Test Scoring
The method of combining item scores to produce test scores and subscores is presented in detail in the Smarter Balanced Scoring Specification document (Smarter Balanced, 2020a). Scores are calculated using maximum likelihood estimation (MLE) applied at the overall and subscore levels. No special weights for claims, item types, or performance tasks are applied. Desired domain representation is achieved by the numbers of items and points specified in the blueprints.
4.12 Item and Task Development
In order to build a summative assessment that measured the intended claims, the Consortium’s test development cycle was iterative, involving experts from various education-related fields, and was based on assessment-related research and best practices. Section 4.12.4 through section 4.12.6 describe vendor-managed item development that Smarter Balanced oversees. Member-managed item writing led by states is described in section 4.12.7.
4.12.1 Item and Task Specifications
The item and task specifications bridge the distance from the content specifications and achievement levels to the assessment itself. While the content specifications establish the Consortium’s claims and the types of evidence that are needed to support these claims, more specificity is needed to develop items and tasks that measured the claims.
The first iteration of the item and task specifications was developed in 2011. In early 2012, the Consortium held a series of showcases where the contractors introduced the item and task specifications and collected feedback from member states. The item and task specifications were revised during the first quarter of 2012 using this feedback.
A small set of items were developed and administered in fall 2012 during a small-scale trial using the revised item and task specifications. This provided the Consortium with the first opportunity to administer and score the new item types. During the small-scale trials, the Consortium also conducted cognitive laboratories to better understand how students respond to various types of items (AIR, 2013). The cognitive laboratories used a think-aloud methodology in which students speak their thoughts while working on a test item. The item and task specifications were again revised based on the findings of the cognitive laboratories and the small-scale trial. These revised specifications were used to develop items for the 2013 pilot test, and they were again revised based on 2013 pilot test results and subsequent reviews by content experts.
The Smarter Balanced Item and Task Specifications (2015c) are designed to ensure that assessment items measure the assessment’s claims. Indeed, the purpose of item and task specifications is to define the characteristics of items and tasks that will provide evidence to support one or more claims. To do this, the item and task specifications delineate types of evidence that should be elicited for each claim within a grade level. Then, the specifications provide explicit guidance on how to write items in order to elicit the desired evidence.
Item and task specifications provide guidelines on how to create items specific to each claim and assessment target through the use of task models. In mathematics, a task model provides a description of an item/task’s key features. These task models describe the knowledge, skills, and processes being measured by each of the item types aligned to particular targets. In addition, task models sometimes provide examples of plausible distractors. Exemplar items are provided within every task model. In ELA/literacy, these functions are carried out through item specifications.
Task models were developed for each grade level and target to delineate the expectations of knowledge and skill to be represented through test questions at each grade. In addition, both ELA/literacy and mathematics item and stimulus specifications provide guidance about grade appropriateness of task and stimulus materials (the materials that a student must refer to in working on a test question). The task and stimulus models also provide information on characteristics of stimuli or activities to avoid because they are not germane to the knowledge, skill, or process being measured.
Guidelines concerning what to avoid in item writing are important because they underscore the Consortium’s efforts to use universal design principles to develop accessible items to the widest range of students possible. As the name suggests, the concept of universal design aims to create items that accurately measure the assessment target for all students. At the same time, universal design recognizes that one solution rarely works for all students. Instead, this framework acknowledges “the need for alternatives to suit many different people” (Rose & Meyer, 2000, p. 4).
To facilitate the application of universal design principles, item writers are trained to consider the full range of students who may answer a test question. A simple example of this is the use of vocabulary that is expected to be known by all third-grade students versus only those third-grade students who play basketball. Almost all third-grade students are familiar with activities (e.g., recess) that happen during their school day, while only a subset of these students will be familiar with basketball terms like “double dribble,” “layup,” “zone defense,” or “full-court press.”
Item specifications discuss accessibility issues unique to the creation of items for a particular claim and/or assessment target. Accessibility issues concern supports that various groups of students may need to access item content. By considering the supports that may be needed for each item, item writers are able to create items that can be adapted to a variety of needs.
The use of universal design principles allows the Consortium to collect evidence on the widest possible range of students. By writing items that adhere to item and task specifications, the Consortium is assured that assessments measure the claims and assessment targets established in content specifications, as well as the knowledge, skills, and processes found in the CCSS for all students for whom the assessment is appropriate.
4.12.2 Performance Task Design
The Race to the Top Assessment Program Application for the Smarter Balanced Assessment Consortium (2010) highlights the importance of performance tasks to “provide a measure of the student’s ability to integrate knowledge and skills across multiple standards—a key component of college and career readiness” (p. 42). The development of an assessment system that fulfills this goal requires an understanding of how the world is changing and what skills are required to compete in an increasingly global economy. Research suggests that measuring college and career readiness will increasingly require the use of performance-based assessments (Fadel, Honey, & Pasnik, 2007).
A key component of college and career readiness is the ability to integrate knowledge and skills across multiple content standards. Smarter Balanced derives inferences concerning this ability through performance tasks. Performance assessments are intended to represent students’ competence in applying the knowledge and cognitive skills needed to solve substantive, meaningful problems. Performance assessments give students opportunities to demonstrate their ability to find, organize, or use information to solve problems; undertake research; frame and conduct investigations; analyze and synthesize data; and apply learning to novel situations.
A Smarter Balanced performance task involves interaction of students with stimulus materials and/or engagement in a problem solution, ultimately leading to an exhibition of the students’ application of knowledge and skills. Stimuli include a variety of information forms (e.g., readings, video clips, data), as well as an assignment or problem situation. As shown in the test blueprints, performance tasks are an integral part of the Smarter Balanced test design. When a performance task is assigned and given in its entirety, it fulfills a specific role in the test blueprint for a grade and content area. Performance tasks are intended to challenge students in applying their knowledge and skills to complex, contextually rich problems. These activities are meant to measure capacities such as depth of understanding, writing or research skills, mathematical modeling, and complex analysis. They consist of collections of questions and activities coherently connected to a single scenario. The performance tasks are administered online via computer (not computer adaptive) and require one to two class periods to complete.
Performance tasks were constructed so they can be delivered effectively in the school/classroom environment (Dana and Tippins, 1993). Requirements for task specifications included, but were not limited to, compatibility with classroom activities, materials and technology needs, and allotted time for assessment. Performance tasks adhere to specifications used by item writers to develop new tasks that focus on different content but are comparable in contribution to the blueprint.
All Smarter Balanced performance tasks consist of three basic components: stimulus presentation, information processing, and scorable product(s) or performance(s). “Information processing” means student interactions with the stimulus materials and their content. It could include note-taking, data generation, and any other activities that increase students’ understanding of the stimulus content or the assignment. All activities within a task must have a rationale for inclusion (e.g., to increase understanding, for scaffolding, as early steps in product creation or for product creation).
In ELA/literacy, each performance task comprises a targeted research effort in which students read sources and respond to one research item, followed by an essay. (Prior to 2018-19, students responded to three research items.) During the research component, students may take notes to which they may later refer. Students then write a full essay drawing from source material and research notes. Claim-level results in writing and research are based on both CAT and performance task item responses.
In mathematics, each performance task comprises a set of stimulus materials and a follow-up item set consisting of up to six items in claims 2, 3, and 4. These are combined with CAT items in claims 2, 3, and 4 to satisfy the blueprint and create a claim 3 score and a combined claim 2 and 4 score. Performance tasks address an integrated scenario in middle and high school and a common theme in grades 3 to 5.
4.12.3 The Item/Task Pool Specification
An item pool refers to a collection of test questions (known as items) that support the test blueprint for a particular content area and grade. The Consortium takes multiple steps to ensure the quality of the items in our item pool. Building on the ongoing process of developing item/task specifications and test blueprints, the Consortium uses an iterative process for creating and revising each item as well as the collection of items. In the initial item development process, the Consortium tested items and refined its approach to item development through three steps: small-scale tryouts, a large pilot test, and a large field test. Details of the pilot and field tests are found in the Smarter Balanced 2013–2014 Technical Report (2016a). During each phase, the Consortium used cognitive laboratories to understand the strategies that students used to respond to the items. By incorporating this tiered and iterative approach, the item and task specifications that guided the development of the final operational pool were improved based on lessons learned during tryouts.
Measurement experts specified the number and distribution of items to be written using test blueprints. Pools of items/tasks were written specifically to support proportions of items and intended difficulty distribution in the operational blueprint. Teachers were integrally involved in the creation of the item/task pool from beginning to end. Some participated in the processes described in the flow charts that appear in the Appendix A. Others developed items through a rigorous item-writing process, and yet others reviewed the items for accuracy and appropriateness of the content knowledge and skill level required to respond to the items. Teams of content experts reviewed items for potential issues of bias in favor of or against any demographic group of students and for accessibility for students with disabilities and English language learners. Content, bias, and accessibility reviews were conducted prior to administration to any students. Following pilot and field test administrations, items were again reviewed if pilot or field test data indicated a potential problem. Finally, teachers participated in range-finding and scoring of constructed-response items/tasks to ensure that the items/tasks could be properly scored given their scoring rubrics.
In this section, the primary role that educators play in creating the field test item pool by writing, reviewing, and scoring items is presented. This section will end by examining the current composition of the item pool.
4.12.4 Item Writing
The Consortium works with educators throughout the test development cycle to develop items. All K–12 participants:
- are certified/licensed to teach ELA/literacy and/or mathematics in a K–12 public school;
- are currently teaching in a public school within a Smarter Balanced governing state;
- have taught ELA/literacy and/or mathematics in grades 3 through 8 and/or high school within the past three years (second-grade teachers are also recruited to participate in the development of grade 3 items and/or tasks);
- have previously reviewed part or all of the CCSS for the content area for which they are writing items and/or performance tasks;
- have submitted a statement of interest that describes their interest in developing Smarter Balanced items and/or performance tasks, along with their qualifications for doing so; and
- have completed training and achieved qualifications through a certification process.
Qualifications for higher education faculty include:
- current employment with, or recent retirement from, a college or university located within a Smarter Balanced member state;
- having taught developmental and/or entry-level courses in English, composition, mathematics, statistics, or a related discipline within the last three years;
- having previously reviewed part or all of the CCSS for the content area in which they are interested in writing items and/or performance tasks; and
- having completed training and achieved qualifications through the certification process.
The Consortium’s staff trains contractors and educators on the item specifications, ELA/literacy stimulus specifications, and the guidelines for accessibility, bias, and sensitivity, as described in the next section.
Prior to the spring 2013 pilot test, the Consortium engaged 136 educators in K–12 and higher education from 19 member states to write items. Prior to the spring 2014 field test, 184 educators in K–12 and higher education from 16 member states participated in item writing. The items developed in this process were used in the 2014 field test and in the 2015 embedded field test. These items account for all of the items used in the 2018-19 summative assessment.
4.12.5 Training
For the development of all operational items in the 2018-19 summative assessment, educators participated in a series of facilitated online webinars in order to qualify as item writers. To facilitate participation, the Consortium scheduled multiple sessions in different time zones, including evening sessions. In addition to the facilitated sessions, the Consortium provided training modules that covered background on the Consortium, assessment design principles, and detailed information about item and performance task development. All modules were available in three formats: a PowerPoint presentation with notes, a streaming presentation with narration that could be viewed online, and a downloadable audio/video presentation.
For all item writing, including more recent processes, item writers are specifically trained on the Consortium’s content and item specifications, stimulus specifications, sensitivity and bias guidelines, and general accessibility guidelines. Training on these specifications and guidelines helps ensure that item writers are trained to write items that allow the widest possible range of students to demonstrate their knowledge, skills, and cognitive processes with regard to the content. This means that item writers need to understand the content for which they were writing items, as well as accessibility and sensitivity issues that might hinder students’ ability to answer an item. Item writers are also trained to be aware of issues that might unintentionally bias an item for or against a particular group.
4.12.6 Educator Participation
Each item that is used operationally on the Smarter Balanced summative assessment has been reviewed and/or written by educators. The active involvement of educators is critical to the success of the item-writing activities. Educators engage with students on a daily basis, and they understand the ways in which students can demonstrate their knowledge. Their involvement in item writing helps ensure that the items included in the assessment system are appropriate for the grade level and provide valid evidence of student learning.
4.12.7 Member-Managed Item Development
The Consortium invites member states to participate in a separate effort to write items. This voluntary effort, known as State-Managed Item Development, is conducted to build the capacity of states to write items and to support the overall sustainability of the Consortium. To this end, three states (HI, OR, and WA) participated in the member-managed field test item development opportunity. During this opportunity, educators within the three states developed approximately 450 items in mathematics and ELA/literacy across grades 3 through 8 and high school.
4.12.8 Item Reviews
Once items are written, groups of educators review items and item stimuli prior to field testing. Item stimuli refer to the reading passages used on the ELA/literacy assessments or to the stimulus materials provided in the performance tasks in both mathematics and ELA/literacy. The reviews take into consideration accessibility, bias/sensitivity, and content.
Prior to the spring 2013 pilot test, 122 ELA/literacy educators and 106 mathematics educators reviewed items and performance tasks for accessibility, bias/sensitivity, or content, and 60 educators reviewed the ELA/literacy stimuli. Prior to the spring 2014 field test, 107 ELA/literacy educators and 157 mathematics educators from 14 states reviewed items and performance, and 95 educators from 13 states reviewed the ELA/literacy stimuli.
The educator qualifications for the accessibility, bias/sensitivity, and content reviews are the same as the educator qualifications for item writing, except that participants are not required to submit a statement of interest. In addition, it is preferred (but not required) that educators have previous experience reviewing items, tasks, and/or stimuli.
During the committee reviews, educators specifically compare the items against the quality criteria for accessibility and for bias and sensitivity. The reviewers identify and resolve or reject any item, stimulus, or performance task that does not pass the criteria. This review removes any aspect that may negatively impact a student’s ability to access stimuli, items, or performance tasks, or to elicit valid evidence about an assessment target. Items flagged for accessibility, bias/sensitivity, and/or content concerns are either revised to address the issues identified by the panelists or removed from the item pool.
The committee also compares each stimulus, item, and performance task against the ELA/literacy or mathematics quality criteria. This review focuses on developmental appropriateness and alignment of stimuli, items, and performance tasks to the content specifications and appropriate depths of knowledge. Panelists in the content review also check the accuracy of the content, answer keys, and scoring materials. Items flagged for content concerns are either revised or removed from the item pool.
Details about the item development process in ELA/literacy and mathematics are found in Appendix A. These are the steps each item goes through before it can be presented to students.
4.13 Field Testing
After items pass the content, accessibility, bias, and sensitivity reviews, they become eligible for field testing. The first field test for developing the Smarter Balanced assessments was a stand-alone field test in 2014 prior to the first operational administration. Details of the 2014 field test can be found in Chapters 7, 8, and 9 of the 2014 Technical Report. Briefly, the field test in 2014 was a comprehensive test that provided data for deciding which items would become operational and constructing the vertical scales that spanned grades for each subject. Beginning with the first operational administration in the 2014–15 school year, and continuing with each operational administration thereafter, field testing is conducted in conjunction with operational assessments. The mechanisms for field testing CAT and performance task items are described in separate sections below.
Technical reports for summative administrations up to 2018–19 describe field test results organized by the year in which items were field tested, but only for those field tests from which operational items were drawn. There is generally a two-year lag between when items are field tested and when they become operational. Results for items field tested in the 2018–19 administration are not described in this report.
4.13.1 Accessibility
Each year, a subset of the field test items are tagged with accessibility resources, including, for example, braille, translated glossaries, and American Sign Language videos, to ensure that all students have an opportunity to participate in field testing. Item metadata indicates which field test items have associated accessibility resources. Accessibility resources may be added to items after field testing as well, details of which depend on the overall availability of items in the general pool that align to the specific needs of a given subpool.
4.13.2 CAT Field Testing
Constraints governing CAT field testing are summarized in Table 4.2. CAT EFT items are administered randomly across a range of allowable positions within test segments as follows:
- ELA: positions 5 through 34 (ELA has only one segment)
- Math Calculator: positions 5 through 15 within the calculator segment
- Math Non-Calculator: positions 5 through 10 within the non-calculator segment
Two items are embedded in the mathematics CAT. For grades 6 and higher, one item is embedded in the calculator segment and one in the non-calculator segment. In the ELA/literacy CAT, three to six field test items are administered. The number of items in ELA ranges from three to six to accommodate the fact that field test passages may be associated with three to six items.
| Grade | ELA/Literacy | Math: Calc | Math: No Calc |
|---|---|---|---|
| 3 | 3 to 6 | N/A | 2 |
| 4 | 3 to 6 | N/A | 2 |
| 5 | 3 to 6 | N/A | 2 |
| 6 | 3 to 6 | 1 | 1 |
| 7 | 3 to 6 | 1 | 1 |
| 8 | 3 to 6 | 1 | 1 |
| 11 | 3 to 6 | 1 | 1 |
Item groups (such as items following a passage) are administered intact and in the same sequence. For example, in a passage with four items, all four items are administered in the same order for every student that receives the passage. The last item administered within a passage is within the range of allowable sequence positions listed above. Due to the fixed sequence within passage, the range over which an item within a passage is administered will be more restricted than the allowable ranges listed above. For example, the allowable positions for the first item in a four-item ELA/literacy passage set are 5 through 31; the allowable positions for the last item in a four-item ELA/literacy passage set are 8 through 34.
4.13.3 Field Testing of Performance Tasks
Performance tasks (PTs) are field tested as stand-alone fixed forms consisting of three to six items per task, depending on the subject and grade. Each performance task is randomly administered to approximately 2,000 students in total across all participating states. Students who take a field test performance task do not take an operational performance task. These students take a CAT that has more operational items than the regular CAT to compensate for the lack of operational PT items. The blueprint for the CAT taken by students who take a field test PT (Smarter Balanced, 2017d) is called an enhanced blueprint, indicating that the CAT session for these students meets the blueprint that is normally met by the combination of CAT plus PT for other students. In order to limit this accommodation to as few students as possible, and in recognition of the fact that the sample size for each field test PT must be at least 2,000 students, the number of PTs field tested each year is limited to three or four per grade. A requirement related to this limitation is that no more than 2% of the student population will have to take a field test PT.
4.13.4 Item Scoring
For those items that cannot be machine scored, the Consortium engages content experts in range-finding activities. Range finding improves the consistency and validity of scoring for the assessment. During range finding, educators focus on the performance tasks for mathematics and ELA/literacy. The participants review student responses against item rubrics, validate the rubrics’ accuracy, and select the anchor papers that would be used by scorers during operational scoring of test items. In mathematics, educators also review constructed response items for grades 7, 8, and high school. Following the 2013 pilot test, 102 participants from 20 states were engaged in range finding. After the spring 2014 field test, 104 educators participated in range finding. After the 2014–15 embedded field test, 34 educators participated in range finding.
The educator qualifications for range finding are the same as the educator qualifications for item writing. It is preferred (but not required) that educators have previous range-finding experience.
A rubric validation activity is conducted to verify correct scoring for machine-scored items. For multiple-choice items, this is a simple key check. For other item types, such as grid interaction items (drag-and-drop), matching tables, or equation entry, the procedure involves looking at a sample of raw student responses (screen coordinates or keystrokes) and assuring that the raw response was scored correctly. In the course of this process, reviewers may find unexpected responses that require adjustment of the scoring procedure to account for a wider response range. Item-scoring software is then changed accordingly.
4.13.5 Item Quality Control Criteria
Quality criteria applied to summative items in the 2018-19 operational pool are shown in Table 4.3. Items that received one or more flags were submitted for data review.
| Flag | Definition |
|---|---|
| A | High difficulty (p-value less than 0.10) |
| B | Polytomous items with percentage obtaining any score category less than 3% of total N |
| C | Polytomous items with higher criterion score mean for students in a lower score-point category |
| D | Selected response items with proportionally more high-proficient students selecting a distractor over the key |
| F | Selected response items with higher criterion score mean for students choosing a distractor than the mean for those choosing the key |
| H | Low difficulty (p-value greater than 0.95) |
| P | Selected response items with positive distractor point-biserial correlation |
| R | Low item-total correlation (point-biserial correlation less than 0.30) |
| DIF | Differential item functioning |
| IR | Hand-scored items that do not meet criteria for inter-rater agreement |
Items with no statistical flags are eligible for use in the operational pools. Flagged items move into operational pools if they are not rejected or revised in data review. Not all operational items approved for operational use are used in summative test pools. Other uses for operational items include achievement level setting, interim assessments, practice tests, and released items. Items for these uses may also be drawn from the pool of items flagged for, or revised in, data review.
Table 4.4 shows how items that were field tested in the 2014 stand-alone field test fell out among various categories of item quality and use. A total of 9,383 ELA/literacy and 10,052 mathematics items were field tested. The middle columns show reasons for not using these items on summative assessments, along with the counts of items for each reason. Ultimately, a total of 5,310 ELA/literacy and 7,028 mathematics items were used in the 2014–15 summative assessment.
| Content Area | Grade | Initial | Content Issues | Small N | Poor Item Stats | Other Uses | 2014-15 Summative |
|---|---|---|---|---|---|---|---|
| ELA/L | 3 | 1,045 | 30 | 31 | 88 | 242 | 654 |
| 4 | 965 | 17 | 32 | 60 | 203 | 653 | |
| 5 | 975 | 23 | 45 | 84 | 178 | 645 | |
| 6 | 984 | 23 | 30 | 82 | 236 | 613 | |
| 7 | 1,033 | 27 | 31 | 100 | 286 | 589 | |
| 8 | 1,010 | 20 | 40 | 114 | 242 | 594 | |
| HS | 3,371 | 61 | 658 | 281 | 809 | 1,562 | |
| Total | 9,383 | 201 | 867 | 809 | 2,196 | 5,310 | |
| Math | 3 | 1,163 | 1 | 0 | 48 | 157 | 957 |
| 4 | 1,207 | 9 | 0 | 68 | 198 | 932 | |
| 5 | 1,108 | 2 | 0 | 63 | 130 | 913 | |
| 6 | 1,115 | 8 | 0 | 89 | 164 | 854 | |
| 7 | 1,037 | 5 | 0 | 90 | 175 | 767 | |
| 8 | 1,036 | 9 | 0 | 133 | 159 | 735 | |
| HS | 3,386 | 75 | 797 | 488 | 156 | 1,870 | |
| Total | 10,052 | 109 | 797 | 979 | 1,139 | 7,028 |
Table 4.5 shows the dispensation of items that were embedded as field test items in the CAT segment of the 2014–15 summative assessment (2015 EFTs). Over 10,000 items were field tested. Approximately one-third of the field tested items in each subject area were flagged for one or more of the reasons given in Table 4.3, plus insufficient data for a small number of items. Approximately 20% of the flagged items were rejected out of hand due to insufficient data or values of key statistics listed in Table 4.3 that were considered too poor for use even if they were approved for use in the data review process. The remainder of the flagged items were submitted for data review. Approximately 62% of the ELA/literacy items and 71% of the mathematics items sent through data review were approved for operational use.
The numbers of items ultimately approved for operational use are shown by grade and subject in the last column of Table 4.5. These included the not-flagged items and the number of items accepted in data review.
| Content Area | Grade | 2015 EFT | Not Flagged | Flagged | Rejected | Data Review: Reject | Data Review: Accept | Approved for Summative |
|---|---|---|---|---|---|---|---|---|
| ELA/L | 3 | 654 | 475 | 179 | 21 | 60 | 98 | 573 |
| 4 | 632 | 456 | 176 | 26 | 49 | 101 | 557 | |
| 5 | 643 | 455 | 188 | 29 | 51 | 108 | 563 | |
| 6 | 633 | 394 | 239 | 36 | 75 | 128 | 522 | |
| 7 | 629 | 390 | 239 | 46 | 80 | 113 | 503 | |
| 8 | 607 | 395 | 212 | 51 | 73 | 88 | 483 | |
| HS | 2,133 | 1,397 | 736 | 162 | 225 | 349 | 1,746 | |
| Total | 5,931 | 3,962 | 1,969 | 371 | 613 | 985 | 4,947 | |
| Math | 3 | 564 | 431 | 133 | 15 | 32 | 86 | 517 |
| 4 | 659 | 543 | 116 | 17 | 28 | 71 | 614 | |
| 5 | 616 | 486 | 130 | 19 | 25 | 86 | 572 | |
| 6 | 674 | 453 | 221 | 47 | 26 | 148 | 601 | |
| 7 | 684 | 377 | 307 | 77 | 64 | 166 | 543 | |
| 8 | 691 | 379 | 312 | 76 | 67 | 169 | 548 | |
| HS | 923 | 460 | 463 | 141 | 127 | 195 | 655 | |
| Total | 4,811 | 3,129 | 1,682 | 392 | 369 | 921 | 4,050 |
Operational items in the 2018-19 summative assessment (N=18,923) were field tested in 2014 (N=11,823 CAT and PT items), in the 2014–15 summative assessment (N=6,841 CAT items), or in the 2016–17 summative assessment (N=239 PT items). The counts in parentheses are the number of operational items by source, not the total number of items field tested. The item quality control criteria and data review process applied to the PT items field tested in 2016–17 were similar to those described above for items field tested earlier. The data review process for items field tested in 2015–16 and 2016–17 was conducted in a single event by Measurement Incorporated.
4.14 2018-19 Summative Item Pool
This section describes the 2018-19 summative item pool. This pool was highly similar to the previous year’s summative item pool. Chapter 8 provides a detailed comparison of these two pools.
Each grade’s item pool is large enough to support the summative blueprint. Unlike a traditional paper-and-pencil test where all students take the same items, students taking the CAT take items and tasks targeted to their ability level. This means that the Consortium needs to develop a large number of items to deliver tests that simultaneously meet the blueprint and are at a level of difficulty that is tailored to each student’s performance.
In addition to the items for the CAT, the Consortium also developed performance tasks. All students take performance tasks designed to measure a student’s ability to integrate knowledge and skills across multiple claims and assessment targets. Prior to 2018–19, each ELA/literacy performance task had a set of related stimuli presented with two or three research items and an essay. Beginning with the 2018–19 assessment, the performance task includes only one research item, and the reduction is compensated by including more research items in the CAT component. Each mathematics performance task continues to have four to six items relating to a central problem or stimulus. The PT items are organized into distinct sets that are delivered intact to students. The number of PT item sets per grade and subject in the 2018-19 summative assessment is shown in Table 4.6. The sets are delivered in randomized fashion to students rather than adaptively.
| Grade | ELA/literacy | Mathematics |
|---|---|---|
| 3 | 19 | 17 |
| 4 | 22 | 23 |
| 5 | 25 | 19 |
| 6 | 19 | 16 |
| 7 | 24 | 18 |
| 8 | 25 | 16 |
| 11 | 28 | 14 |
The distribution of item parameters by grade and claim are shown in Table 4.7 (ELA/literacy) and Table 4.8 (mathematics). Note that there is a wide range of difficulty in each category. This enables the algorithm (described previously in this chapter) to find the best items for each student. As such, adaptive tests provide more precise measurement for all levels of student performance than would be provided with a fixed-form test of the same length. This is accomplished through having a bank of previously calibrated items to deliver during the adaptive portion of the test. In addition, fixed, randomly assigned performance tasks add information to student performance.
| Grade | Claim | # of Items | b parameter Mean | b parameter Min | b parameter Max | a parameter Mean |
|---|---|---|---|---|---|---|
| 3 | 1 | 317 | -0.542 | -2.725 | 4.693 | 0.70 |
| 2 | 252 | -0.834 | -2.896 | 4.115 | 0.68 | |
| 3 | 186 | -0.177 | -2.920 | 3.816 | 0.54 | |
| 4 | 150 | -0.280 | -2.216 | 1.864 | 0.68 | |
| Total | 905 | -0.505 | -2.920 | 4.693 | 0.66 | |
| 4 | 1 | 255 | 0.282 | -2.529 | 6.233 | 0.63 |
| 2 | 256 | -0.389 | -3.252 | 2.935 | 0.59 | |
| 3 | 197 | 0.034 | -2.822 | 4.254 | 0.55 | |
| 4 | 159 | 0.405 | -1.996 | 3.727 | 0.57 | |
| Total | 867 | 0.050 | -3.252 | 6.233 | 0.59 | |
| 5 | 1 | 279 | 0.668 | -1.784 | 5.651 | 0.61 |
| 2 | 251 | -0.004 | -2.278 | 3.294 | 0.61 | |
| 3 | 153 | 0.506 | -2.403 | 3.481 | 0.52 | |
| 4 | 154 | 0.530 | -1.494 | 3.832 | 0.66 | |
| Total | 837 | 0.411 | -2.403 | 5.651 | 0.60 | |
| 6 | 1 | 254 | 1.112 | -1.636 | 4.779 | 0.60 |
| 2 | 269 | 0.848 | -2.719 | 5.542 | 0.57 | |
| 3 | 160 | 0.827 | -1.497 | 7.385 | 0.50 | |
| 4 | 166 | 0.967 | -1.305 | 3.609 | 0.58 | |
| Total | 849 | 0.946 | -2.719 | 7.385 | 0.57 | |
| 7 | 1 | 251 | 1.383 | -1.836 | 6.630 | 0.57 |
| 2 | 251 | 1.095 | -2.019 | 5.305 | 0.56 | |
| 3 | 159 | 0.872 | -1.706 | 5.885 | 0.50 | |
| 4 | 122 | 1.702 | -0.815 | 5.613 | 0.56 | |
| Total | 783 | 1.237 | -2.019 | 6.630 | 0.55 | |
| 8 | 1 | 264 | 1.590 | -1.170 | 6.421 | 0.58 |
| 2 | 279 | 1.087 | -3.014 | 4.558 | 0.53 | |
| 3 | 188 | 0.926 | -2.119 | 3.871 | 0.48 | |
| 4 | 134 | 1.559 | -1.788 | 5.188 | 0.58 | |
| Total | 865 | 1.279 | -3.014 | 6.421 | 0.55 | |
| 11 | 1 | 892 | 1.933 | -2.087 | 9.101 | 0.54 |
| 2 | 766 | 1.751 | -1.880 | 9.145 | 0.47 | |
| 3 | 595 | 1.362 | -1.648 | 6.621 | 0.45 | |
| 4 | 415 | 1.967 | -1.197 | 8.941 | 0.48 | |
| Total | 2,668 | 1.759 | -2.087 | 9.145 | 0.49 |
| Grade | Claim | # of Items | b parameter Mean | b parameter Min | b parameter Max | a parameter Mean |
|---|---|---|---|---|---|---|
| 3 | 1 | 809 | -1.133 | -4.338 | 4.163 | 0.84 |
| 2 | 129 | -0.496 | -2.537 | 1.380 | 1.00 | |
| 3 | 241 | -0.129 | -2.424 | 5.116 | 0.73 | |
| 4 | 150 | -0.174 | -2.677 | 3.201 | 0.81 | |
| Total | 1,329 | -0.781 | -4.338 | 5.116 | 0.83 | |
| 4 | 1 | 862 | -0.283 | -3.260 | 4.483 | 0.85 |
| 2 | 158 | -0.093 | -2.248 | 2.574 | 0.89 | |
| 3 | 257 | 0.300 | -2.083 | 5.184 | 0.76 | |
| 4 | 164 | 0.255 | -2.148 | 3.284 | 0.70 | |
| Total | 1,441 | -0.097 | -3.260 | 5.184 | 0.82 | |
| 5 | 1 | 819 | 0.325 | -2.791 | 6.202 | 0.77 |
| 2 | 128 | 0.773 | -2.208 | 3.939 | 0.93 | |
| 3 | 253 | 0.896 | -1.903 | 5.976 | 0.67 | |
| 4 | 173 | 1.193 | -1.232 | 4.634 | 0.70 | |
| Total | 1,373 | 0.581 | -2.791 | 6.202 | 0.76 | |
| 6 | 1 | 777 | 0.835 | -3.934 | 9.158 | 0.69 |
| 2 | 117 | 1.123 | -2.978 | 5.497 | 0.77 | |
| 3 | 223 | 1.792 | -2.161 | 8.754 | 0.59 | |
| 4 | 122 | 1.635 | -0.853 | 6.439 | 0.78 | |
| Total | 1,239 | 1.113 | -3.934 | 9.158 | 0.69 | |
| 7 | 1 | 712 | 1.737 | -1.792 | 7.801 | 0.73 |
| 2 | 120 | 1.687 | -1.085 | 5.071 | 0.83 | |
| 3 | 177 | 2.191 | -1.654 | 6.594 | 0.61 | |
| 4 | 130 | 2.032 | -0.881 | 4.777 | 0.75 | |
| Total | 1,139 | 1.836 | -1.792 | 7.801 | 0.73 | |
| 8 | 1 | 645 | 2.045 | -1.868 | 7.752 | 0.58 |
| 2 | 85 | 2.429 | -1.570 | 5.751 | 0.75 | |
| 3 | 164 | 2.846 | -0.878 | 9.022 | 0.50 | |
| 4 | 100 | 2.214 | -2.844 | 6.476 | 0.68 | |
| Total | 994 | 2.227 | -2.844 | 9.022 | 0.59 | |
| 11 | 1 | 1,855 | 2.351 | -4.432 | 8.724 | 0.60 |
| 2 | 189 | 2.980 | -1.101 | 6.680 | 0.63 | |
| 3 | 429 | 3.029 | -1.049 | 9.254 | 0.46 | |
| 4 | 207 | 3.215 | 0.324 | 6.379 | 0.54 | |
| Total | 2,680 | 2.571 | -4.432 | 9.254 | 0.58 |
The Consortium develops many different types of items beyond the traditional multiple-choice item. This is done to measure claims and assessment targets with varying degrees of complexity by allowing students to respond in a variety of ways rather than simply recognizing a correct response. These different item types are listed in Table 4.9. The frequency of item types by claim within grade and subject is shown in Table 4.10 and Table 4.11. Note that each essay written is associated with two items. Essays are scored on three traits, two of which are combined, resulting in two items for each essay.
| Item Types | ELA/literacy | Mathematics |
|---|---|---|
| Multiple Choice (MC) | X | X |
| Multiple Select (MS) | X | X |
| Evidence-Based Selected Response (EBSR) | X | |
| Match Interaction (MI) | X | X |
| Hot Text (HTQ) | X | |
| Short Answer Text Response (SA) | X | X |
| Essay/Writing Extended Response (WER) | X | |
| Equation Response (EQ) | X | |
| Grid Item Response (GI) | X | |
| Table Interaction (TI) | X |
| Grade | Claim | EBSR | HTQ | MC | MI | MS | SA | WER | Total |
|---|---|---|---|---|---|---|---|---|---|
| 3 | 1 | 47 | 54 | 168 | 0 | 48 | 0 | 0 | 317 |
| 3 | 2 | 0 | 55 | 121 | 0 | 57 | 0 | 19 | 252 |
| 3 | 3 | 48 | 0 | 79 | 20 | 39 | 0 | 0 | 186 |
| 3 | 4 | 0 | 22 | 68 | 6 | 42 | 12 | 0 | 150 |
| 3 | Total | 95 | 131 | 436 | 26 | 186 | 12 | 19 | 905 |
| 4 | 1 | 48 | 51 | 107 | 0 | 49 | 0 | 0 | 255 |
| 4 | 2 | 0 | 55 | 131 | 0 | 48 | 0 | 22 | 256 |
| 4 | 3 | 48 | 0 | 89 | 21 | 39 | 0 | 0 | 197 |
| 4 | 4 | 0 | 20 | 67 | 5 | 52 | 15 | 0 | 159 |
| 4 | Total | 96 | 126 | 394 | 26 | 188 | 15 | 22 | 867 |
| 5 | 1 | 54 | 47 | 115 | 0 | 63 | 0 | 0 | 279 |
| 5 | 2 | 0 | 46 | 117 | 0 | 63 | 0 | 25 | 251 |
| 5 | 3 | 39 | 0 | 68 | 18 | 28 | 0 | 0 | 153 |
| 5 | 4 | 0 | 27 | 57 | 3 | 51 | 16 | 0 | 154 |
| 5 | Total | 93 | 120 | 357 | 21 | 205 | 16 | 25 | 837 |
| 6 | 1 | 38 | 59 | 78 | 0 | 50 | 29 | 0 | 254 |
| 6 | 2 | 0 | 58 | 95 | 0 | 70 | 27 | 19 | 269 |
| 6 | 3 | 41 | 0 | 77 | 18 | 24 | 0 | 0 | 160 |
| 6 | 4 | 0 | 19 | 69 | 3 | 61 | 14 | 0 | 166 |
| 6 | Total | 79 | 136 | 319 | 21 | 205 | 70 | 19 | 849 |
| 7 | 1 | 38 | 49 | 91 | 0 | 48 | 25 | 0 | 251 |
| 7 | 2 | 0 | 51 | 87 | 0 | 63 | 26 | 24 | 251 |
| 7 | 3 | 44 | 0 | 70 | 14 | 31 | 0 | 0 | 159 |
| 7 | 4 | 0 | 36 | 33 | 3 | 29 | 21 | 0 | 122 |
| 7 | Total | 82 | 136 | 281 | 17 | 171 | 72 | 24 | 783 |
| 8 | 1 | 43 | 53 | 82 | 0 | 53 | 33 | 0 | 264 |
| 8 | 2 | 0 | 49 | 99 | 0 | 78 | 28 | 25 | 279 |
| 8 | 3 | 25 | 0 | 120 | 6 | 37 | 0 | 0 | 188 |
| 8 | 4 | 0 | 34 | 42 | 4 | 34 | 20 | 0 | 134 |
| 8 | Total | 68 | 136 | 343 | 10 | 202 | 81 | 25 | 865 |
| 11 | 1 | 157 | 173 | 238 | 0 | 217 | 107 | 0 | 892 |
| 11 | 2 | 0 | 188 | 238 | 0 | 258 | 54 | 28 | 766 |
| 11 | 3 | 111 | 0 | 327 | 18 | 139 | 0 | 0 | 595 |
| 11 | 4 | 0 | 93 | 176 | 15 | 107 | 24 | 0 | 415 |
| 11 | Total | 268 | 454 | 979 | 33 | 721 | 185 | 28 | 2,668 |
| All | Total | 781 | 1,239 | 3,109 | 154 | 1,878 | 451 | 162 | 7,774 |
| Grade | Claim | EQ | GI | MC | MI | MS | SA | TI | Total |
|---|---|---|---|---|---|---|---|---|---|
| 3 | 1 | 502 | 69 | 124 | 77 | 4 | 0 | 33 | 809 |
| 3 | 2 | 83 | 16 | 14 | 6 | 6 | 4 | 0 | 129 |
| 3 | 3 | 13 | 56 | 88 | 23 | 34 | 27 | 0 | 241 |
| 3 | 4 | 56 | 17 | 31 | 10 | 12 | 7 | 17 | 150 |
| 3 | Total | 654 | 158 | 257 | 116 | 56 | 38 | 50 | 1,329 |
| 4 | 1 | 464 | 81 | 112 | 191 | 0 | 0 | 14 | 862 |
| 4 | 2 | 98 | 14 | 32 | 7 | 4 | 1 | 2 | 158 |
| 4 | 3 | 25 | 78 | 65 | 19 | 33 | 36 | 1 | 257 |
| 4 | 4 | 44 | 18 | 60 | 4 | 10 | 15 | 13 | 164 |
| 4 | Total | 631 | 191 | 269 | 221 | 47 | 52 | 30 | 1,441 |
| 5 | 1 | 441 | 47 | 236 | 94 | 1 | 0 | 0 | 819 |
| 5 | 2 | 94 | 13 | 11 | 2 | 3 | 0 | 5 | 128 |
| 5 | 3 | 20 | 65 | 88 | 20 | 24 | 33 | 3 | 253 |
| 5 | 4 | 62 | 35 | 27 | 6 | 6 | 19 | 18 | 173 |
| 5 | Total | 617 | 160 | 362 | 122 | 34 | 52 | 26 | 1,373 |
| 6 | 1 | 376 | 72 | 72 | 103 | 136 | 0 | 18 | 777 |
| 6 | 2 | 73 | 14 | 7 | 3 | 11 | 2 | 7 | 117 |
| 6 | 3 | 23 | 51 | 50 | 31 | 41 | 27 | 0 | 223 |
| 6 | 4 | 61 | 12 | 9 | 3 | 12 | 12 | 13 | 122 |
| 6 | Total | 533 | 149 | 138 | 140 | 200 | 41 | 38 | 1,239 |
| 7 | 1 | 399 | 51 | 57 | 74 | 131 | 0 | 0 | 712 |
| 7 | 2 | 85 | 7 | 8 | 6 | 11 | 0 | 3 | 120 |
| 7 | 3 | 27 | 45 | 36 | 17 | 32 | 20 | 0 | 177 |
| 7 | 4 | 68 | 27 | 18 | 2 | 10 | 2 | 3 | 130 |
| 7 | Total | 579 | 130 | 119 | 99 | 184 | 22 | 6 | 1,139 |
| 8 | 1 | 254 | 44 | 163 | 84 | 80 | 0 | 20 | 645 |
| 8 | 2 | 55 | 12 | 4 | 4 | 2 | 0 | 8 | 85 |
| 8 | 3 | 15 | 52 | 25 | 20 | 29 | 23 | 0 | 164 |
| 8 | 4 | 40 | 23 | 15 | 5 | 7 | 6 | 4 | 100 |
| 8 | Total | 364 | 131 | 207 | 113 | 118 | 29 | 32 | 994 |
| 11 | 1 | 691 | 295 | 436 | 314 | 111 | 0 | 8 | 1,855 |
| 11 | 2 | 93 | 40 | 25 | 12 | 13 | 1 | 5 | 189 |
| 11 | 3 | 50 | 141 | 122 | 52 | 38 | 25 | 1 | 429 |
| 11 | 4 | 97 | 30 | 44 | 13 | 12 | 6 | 5 | 207 |
| 11 | Total | 931 | 506 | 627 | 391 | 174 | 32 | 19 | 2,680 |
| All | Total | 4,309 | 1,425 | 1,979 | 1,202 | 813 | 266 | 201 | 10,195 |
Although there is a wide distribution of item difficulty, pools tend to be difficult in relation to the population and to the cut score that is typically associated with proficiency (level 3 cut score). Figure 4.3 shows mean item difficulty, level 3 cut score, and mean student achievement scores (all in theta units) by grade and subject. The mean item difficulty and student achievement plotted in this figure are based on the 2018-19 assessment.
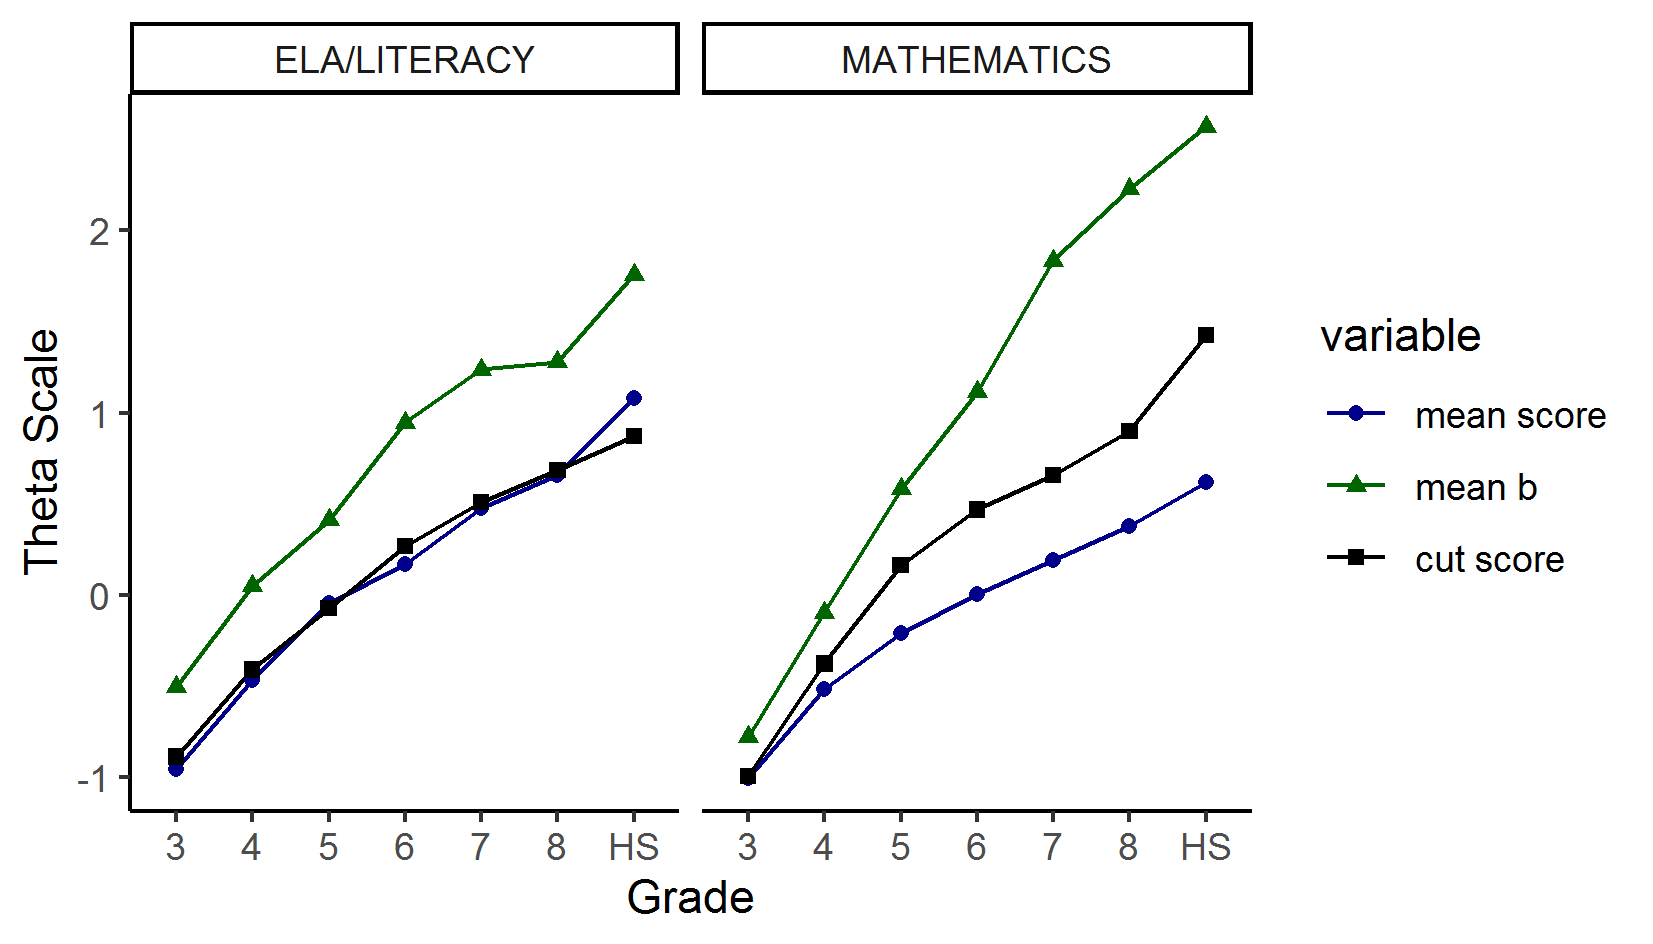
Figure 4.3: Comparison of Item Difficulty, Mean, Student Scores, Cut Scores for ELA/Literacy and Mathematics
4.15 Blueprint Fidelity
Whether the tests students receive in Smarter Balanced assessments satisfy the blueprint requirements described earlier in this chapter depends on two basic elements of test design: 1) the CAT algorithm and 2) the item pool. The CAT algorithm endorsed by Smarter Balanced is publicly available (Cohen & Albright, 2014) and is used by American Institutes for Research (AIR) in delivering Smarter Balanced assessments in the majority of member states. Key features of the item pool are described in the preceding section and include the number of items in specific areas of the blueprint (such as claims) and their distribution in difficulty relative to the distribution of student achievement. Studies of item pool design even more detailed than those presented in this chapter are performed routinely for purposes of item development and evaluation of item pools provided for the summative assessment each year.
Simulation studies are performed in the process of developing the item pool for several reasons, one of the most important being to verify that the test blueprint can be met for all students. Other purposes include establishing weights used in the CAT algorithm to control item exposure and maximizing measurement precision within the constraint of meeting the blueprint for all students. Results presented in Chapter 2, like the blueprint fulfillment results in this section, are essentially the result of the CAT algorithm, with its weights, interacting with the item pool as described in the preceding section. Results in this report may also be affected by how the CAT algorithms used by other vendors interact with the item pool design. A full report of the blueprint fidelity analysis for the 2018-19 summative assessment is available (Smarter Balanced Assessment Consortium, 2020b). The following paragraphs summarize the results of this study.
Analyses using 2018-19 operational assessment data were performed for both ELA/literacy and mathematics and in all the tested grade levels (3–8 and high school). For ELA/literacy, blueprint fulfillment was evaluated separately for three populations at each grade level: the general student population, the braille student population, and the American Sign Language (ASL) population. For mathematics, blueprint fulfillment was evaluated separately for five populations at each grade level: the general student population, the braille student population, the ASL student population, the Spanish student population, and the translated glossaries population. Only operational items from the computerized adaptive test (CAT) component were considered in this study; field test items and performance task (PT) component items were not included.
For each population of students within grade and content area, blueprint fulfillment was assessed at the following levels of detail:
- Claims. The blueprint specifies the number of items per claim and, for ELA/literacy, the number of items associated with informational vs. literary texts in claim 1. In mathematics, the blueprint fidelity analysis combines claims 2 and 4 since these claims are combined for purposes of subscore reporting.
- Mathematics target group. Targets are grouped within claims. The number of items per target group is specified in the blueprint.
- DOK requirements. DOK stands for depth of knowledge. In both ELA/literacy and mathematics, the blueprint specifies the number of items that must represent a given DOK level or higher within certain categories of the blueprint, such as claims and target groups.
The analyses showed that the operational tests delivered in the 2018-19 administration fulfilled the blueprint requirements very well. Virtually all tests delivered to students in the general population met blueprint requirements for the number of items per claim, target group, and depth of knowledge (DOK) within claim. Specifically:
At the level of claims and subclaims within grade:
In ELA/literacy, there were 35 evaluations. In all 35, 100% of tests met blueprint requirements.
In mathematics, there were 28 evaluations. In 24, 100% of tests met blueprint requirements. In the remaining four, no less than 99.95% of tests met blueprint requirements.
At the level of target groups within claims within grade in mathematics, there were 96 evaluations:
In 72, 100% of tests met the blueprint.
In 17, no less than 99.6% of tests met blueprint.
In 1, 98.5% of tests met blueprint.
In 6, representing target groups within claim 3, grades 6 and 11, 52% to 71% of tests met blueprint; the remainder were within one item (too many or too few) of meeting blueprint.
At the level of DOK requirements within targets and/or claims within grade:
In ELA/literacy, there were 80 evaluations. In 42, 100% of tests met blueprint. In 29, over 99% of tests met blueprint. There was some difficulty meeting requirements for a DOK 3 level Brief Write item in grades 6 through 8 and 11. Approximately 91% of tests met this requirement.
In mathematics, there were 94 evaluations. In 60, 100% of tests met blueprint. In 17, over 99% of tests met blueprint. The lowest percentage of tests meeting blueprint (94%) was for five DOK 1 items in claim 1 at grade 3.
Results for special populations had the same patterns as noted above for the general population. Aside from these patterns, there were very few evaluations in which fewer than 90% of tests for special populations met blueprint requirements, but 100% of tests for the general population did. Examples of these instances included:
25% of braille ELA/literacy tests in grade 7 exceeded by one item the blueprint requirement of six CAT items for claim 2.
11% of glossary pool tests in grade 11 exceeded by one item the blueprint requirement of one item representing target group 3: A,B in claim 1.
In the Spanish pool, there were likewise two grades in which a small percentage of tests exceeded the blueprint requirement by one item.
Deviations from blueprint requirements, though rare, are always investigated by Smarter Balanced. For purposes of future item development, Smarter notes the few combinations of requirements that were met by fewer than 90% of tests. These cases are more likely to occur for combinations of claims, targets, and DOK requirements and within certain grades and accommodations pools. They indicate the possibility of systematic shortages or surpluses of items in some areas of the blueprint that should be addressed through item development. The possibilities that the CAT algorithm should be adjusted or that the blueprint is more restrictive than necessary and should be modified are also considered. Also considered are the sample sizes for some groups, such as braille students, which can be quite small and cause blueprint fidelity percentages to fall below a certain threshold, such as 90%, by chance.
Practical, logistical constraints in test delivery that are not accommodated in the blueprint can also lead to minor deviations between the blueprints and the tests actually delivered to students. The mathematics CAT session in grades 6 and higher is a mixture of calculator and no-calculator items. For logistic reasons, the CAT session is therefore partitioned into calculator and non-calculator segments, which are sequential. The blueprint does not specify the number of items nor any other details pertaining to each segment. This lack of specificity can occasionally lead to a blueprint distribution of items in the first segment that cannot be balanced in complementary fashion in the second segment, such that both segments combined meet the blueprint. This and other similar issues will have to be addressed in the future by one or more of the following: 1) increasing the specificity of goals in item development, 2) modifying the CAT algorithm, and 3) modifying test blueprints.
4.16 Item Exposure
Item exposure, like test blueprint fidelity, is a function of the item pool and CAT algorithm, which are basic features of test design. Hence, information about item exposure is included in this chapter on test design. Item exposure rates were obtained using online and adaptive test instances with valid scale scores for which item data were available from the 2018-19 summative administration. The exposure rate for a given item is the proportion of test instances in the grade and content area on which the item appeared.
Table 4.12 and Table 4.13 present a summary of the item exposure results for ELA/literacy and mathematics, respectively. Within each grade and component (CAT and PT), both tables present the number of items in the operational pool (N), along with various descriptive statistics, including the mean, standard deviation (SD), range (min, max), and median of the observed exposure rates. For example, Table 4.12 shows that, on average, each CAT item eligible for administration at grade 3 was seen by 4% of grade 3 examinees. As a rule of thumb, Smarter Balanced attempts to maintain a maximum exposure rate of 25% (i.e., no more than 25% of examinees will see the same item). Table 4.12 shows that the mean and median exposure rates for ELA/literacy items are well below 25%. Table 4.13 shows that the mean and median exposure rates for mathematics items are also well below 25%. Patterns of item exposure for PT items will differ from those for CAT items due to the fact that PT item sets are randomly selected and administered within grade, whereas CAT items are administered adaptively.
Table 4.14 and Table 4.15 provide further information about item exposure by showing the number of and proportion of items in the operational pool (N) with exposure rates falling into certain ranges (bins with a width of 0.1), including those that were completely unexposed (unused). Due to rounding and the large number of items per grade within subject, values of 0.00 in these tables does not necessarily mean that no items had exposure rates falling into the ranges indicated by the column headings. Table 4.14 shows that over 80% of ELA/literacy CAT items had exposure rates between 0 and 10% (0.0–0.1]. Also, nearly all of the PT items had item exposure rates between 0 and 10%. Table 4.15 shows that the majority of mathematics CAT items had item exposure rates between 0 and 10%.
Exposure rates above 30% may indicate that some blueprint requirements are being filled by a relatively small number of items. The number and difficulty distribution of these items within their blueprint categories needs to be further investigated. Future item development could help provide greater pool depth to reduce overexposure.
Some members have reported that a relatively small proportion of items accounts for the majority of the items actually seen by examinees participating in their assessments. Such findings might typically be accompanied by evidence of overexposure. The fact that overexposure is not a problem in this case suggests there may be an excess of items in some areas of the blueprint. Further analyses of the item pool, including more detailed analysis of exposure rates, can reveal these areas and lead to greater efficiency in item development and pool design.
| Grade | Type | N | Mean | SD | Min | Max | Median |
|---|---|---|---|---|---|---|---|
| 3 | CAT | 878 | 0.04 | 0.06 | 0.00 | 0.48 | 0.02 |
| 4 | CAT | 880 | 0.04 | 0.05 | 0.00 | 0.48 | 0.02 |
| 5 | CAT | 846 | 0.04 | 0.06 | 0.00 | 0.44 | 0.02 |
| 6 | CAT | 857 | 0.04 | 0.05 | 0.00 | 0.45 | 0.02 |
| 7 | CAT | 777 | 0.04 | 0.07 | 0.00 | 0.44 | 0.01 |
| 8 | CAT | 828 | 0.05 | 0.07 | 0.00 | 0.74 | 0.02 |
| HS | CAT | 2,557 | 0.01 | 0.02 | 0.00 | 0.26 | 0.01 |
| 3 | PT | 38 | 0.06 | 0.02 | 0.04 | 0.09 | 0.06 |
| 4 | PT | 44 | 0.06 | 0.02 | 0.04 | 0.07 | 0.06 |
| 5 | PT | 50 | 0.05 | 0.02 | 0.03 | 0.07 | 0.05 |
| 6 | PT | 38 | 0.06 | 0.02 | 0.04 | 0.09 | 0.06 |
| 7 | PT | 48 | 0.05 | 0.02 | 0.03 | 0.07 | 0.05 |
| 8 | PT | 50 | 0.06 | 0.02 | 0.04 | 0.08 | 0.06 |
| HS | PT | 56 | 0.05 | 0.02 | 0.04 | 0.07 | 0.05 |
| Grade | Type | N | Mean | SD | Min | Max | Median |
|---|---|---|---|---|---|---|---|
| 3 | CAT | 1,311 | 0.02 | 0.04 | 0.00 | 0.37 | 0.01 |
| 4 | CAT | 1,402 | 0.02 | 0.02 | 0.00 | 0.19 | 0.01 |
| 5 | CAT | 1,375 | 0.02 | 0.03 | 0.00 | 0.38 | 0.01 |
| 6 | CAT | 1,248 | 0.02 | 0.04 | 0.00 | 0.33 | 0.01 |
| 7 | CAT | 1,099 | 0.03 | 0.05 | 0.00 | 0.37 | 0.01 |
| 8 | CAT | 928 | 0.04 | 0.07 | 0.00 | 0.71 | 0.01 |
| HS | CAT | 2,610 | 0.01 | 0.03 | 0.00 | 0.34 | 0.00 |
| 3 | PT | 95 | 0.05 | 0.00 | 0.05 | 0.05 | 0.05 |
| 4 | PT | 116 | 0.03 | 0.00 | 0.03 | 0.04 | 0.03 |
| 5 | PT | 105 | 0.04 | 0.00 | 0.04 | 0.04 | 0.04 |
| 6 | PT | 92 | 0.05 | 0.00 | 0.05 | 0.05 | 0.05 |
| 7 | PT | 92 | 0.04 | 0.00 | 0.04 | 0.05 | 0.04 |
| 8 | PT | 79 | 0.06 | 0.00 | 0.06 | 0.06 | 0.06 |
| HS | PT | 70 | 0.07 | 0.00 | 0.07 | 0.07 | 0.07 |
| Grade | Type | N | Unused | (0.0, 0.1] | (0.1, 0.2] | (0.2, 0.3] | (0.3, 0.4] | (0.4, 0.5] | (0.5, 0.6] | (0.6, 0.7] | (0.7, 0.8] | (0.8, 0.9] | (0.9, 1.0] |
|---|---|---|---|---|---|---|---|---|---|---|---|---|---|
| 3 | CAT | 878 | 0.00 | 0.91 | 0.06 | 0.01 | 0.01 | 0.01 | 0.00 | 0.00 | 0.00 | 0.00 | 0.00 |
| 4 | CAT | 882 | 0.00 | 0.91 | 0.06 | 0.02 | 0.00 | 0.00 | 0.00 | 0.00 | 0.00 | 0.00 | 0.00 |
| 5 | CAT | 846 | 0.00 | 0.90 | 0.07 | 0.02 | 0.01 | 0.00 | 0.00 | 0.00 | 0.00 | 0.00 | 0.00 |
| 6 | CAT | 881 | 0.03 | 0.87 | 0.08 | 0.02 | 0.00 | 0.00 | 0.00 | 0.00 | 0.00 | 0.00 | 0.00 |
| 7 | CAT | 802 | 0.03 | 0.86 | 0.06 | 0.03 | 0.01 | 0.01 | 0.00 | 0.00 | 0.00 | 0.00 | 0.00 |
| 8 | CAT | 853 | 0.03 | 0.84 | 0.08 | 0.04 | 0.01 | 0.00 | 0.00 | 0.00 | 0.00 | 0.00 | 0.00 |
| HS | CAT | 2,557 | 0.00 | 0.99 | 0.01 | 0.00 | 0.00 | 0.00 | 0.00 | 0.00 | 0.00 | 0.00 | 0.00 |
| 3 | PT | 38 | 0.00 | 1.00 | 0.00 | 0.00 | 0.00 | 0.00 | 0.00 | 0.00 | 0.00 | 0.00 | 0.00 |
| 4 | PT | 44 | 0.00 | 1.00 | 0.00 | 0.00 | 0.00 | 0.00 | 0.00 | 0.00 | 0.00 | 0.00 | 0.00 |
| 5 | PT | 50 | 0.00 | 1.00 | 0.00 | 0.00 | 0.00 | 0.00 | 0.00 | 0.00 | 0.00 | 0.00 | 0.00 |
| 6 | PT | 38 | 0.00 | 1.00 | 0.00 | 0.00 | 0.00 | 0.00 | 0.00 | 0.00 | 0.00 | 0.00 | 0.00 |
| 7 | PT | 48 | 0.00 | 1.00 | 0.00 | 0.00 | 0.00 | 0.00 | 0.00 | 0.00 | 0.00 | 0.00 | 0.00 |
| 8 | PT | 50 | 0.00 | 1.00 | 0.00 | 0.00 | 0.00 | 0.00 | 0.00 | 0.00 | 0.00 | 0.00 | 0.00 |
| HS | PT | 56 | 0.00 | 1.00 | 0.00 | 0.00 | 0.00 | 0.00 | 0.00 | 0.00 | 0.00 | 0.00 | 0.00 |
| Grade | Type | N | Unused | (0.0, 0.1] | (0.1, 0.2] | (0.2, 0.3] | (0.3, 0.4] | (0.4, 0.5] | (0.5, 0.6] | (0.6, 0.7] | (0.7, 0.8] | (0.8, 0.9] | (0.9, 1.0] |
|---|---|---|---|---|---|---|---|---|---|---|---|---|---|
| 3 | CAT | 1,311 | 0.00 | 0.95 | 0.04 | 0.01 | 0.00 | 0.00 | 0.00 | 0.00 | 0.00 | 0.00 | 0.00 |
| 4 | CAT | 1,402 | 0.00 | 0.98 | 0.02 | 0.00 | 0.00 | 0.00 | 0.00 | 0.00 | 0.00 | 0.00 | 0.00 |
| 5 | CAT | 1,376 | 0.00 | 0.97 | 0.02 | 0.00 | 0.00 | 0.00 | 0.00 | 0.00 | 0.00 | 0.00 | 0.00 |
| 6 | CAT | 1,248 | 0.00 | 0.95 | 0.03 | 0.01 | 0.00 | 0.00 | 0.00 | 0.00 | 0.00 | 0.00 | 0.00 |
| 7 | CAT | 1,099 | 0.00 | 0.92 | 0.06 | 0.02 | 0.00 | 0.00 | 0.00 | 0.00 | 0.00 | 0.00 | 0.00 |
| 8 | CAT | 928 | 0.00 | 0.91 | 0.06 | 0.01 | 0.01 | 0.00 | 0.00 | 0.00 | 0.00 | 0.00 | 0.00 |
| HS | CAT | 2,610 | 0.00 | 0.98 | 0.01 | 0.01 | 0.00 | 0.00 | 0.00 | 0.00 | 0.00 | 0.00 | 0.00 |
| 3 | PT | 95 | 0.00 | 1.00 | 0.00 | 0.00 | 0.00 | 0.00 | 0.00 | 0.00 | 0.00 | 0.00 | 0.00 |
| 4 | PT | 116 | 0.00 | 1.00 | 0.00 | 0.00 | 0.00 | 0.00 | 0.00 | 0.00 | 0.00 | 0.00 | 0.00 |
| 5 | PT | 105 | 0.00 | 1.00 | 0.00 | 0.00 | 0.00 | 0.00 | 0.00 | 0.00 | 0.00 | 0.00 | 0.00 |
| 6 | PT | 92 | 0.00 | 1.00 | 0.00 | 0.00 | 0.00 | 0.00 | 0.00 | 0.00 | 0.00 | 0.00 | 0.00 |
| 7 | PT | 92 | 0.00 | 1.00 | 0.00 | 0.00 | 0.00 | 0.00 | 0.00 | 0.00 | 0.00 | 0.00 | 0.00 |
| 8 | PT | 79 | 0.00 | 1.00 | 0.00 | 0.00 | 0.00 | 0.00 | 0.00 | 0.00 | 0.00 | 0.00 | 0.00 |
| HS | PT | 70 | 0.00 | 1.00 | 0.00 | 0.00 | 0.00 | 0.00 | 0.00 | 0.00 | 0.00 | 0.00 | 0.00 |
4.17 Summary of Test Design
The intent of this chapter is to show how the assessment design supports the purposes of Smarter Balanced summative assessments. Content specifications were derived directly from the CCSS, expressing the standards as measurable elements and made explicit in Smarter Balanced claims and assessment targets structure. Building on the content specifications, test blueprints provide appropriate proportions of CCSS content coverage. Using the blueprints, item writers wrote items and tasks in quantities that supported CAT and performance task delivery. Expansion of item and task types promoted student responses that provide more insight into proficiency than that provided by multiple-choice items alone. The use of performance tasks addresses the need to assess application and integration of skills. The method of delivery and test scoring, combining adaptive and non-adaptive elements, provides the most precise information and an enhanced student testing experience.
The measurement properties summarized in Chapter 2 and in the sections of this chapter on item exposure and blueprint fidelity are very much functions of the item pool and CAT algorithm. The CAT algorithm has not substantially changed since it was first used in the 2014–15 summative assessment. Details of this algorithm are available in a separate report (Cohen & Albright, 2014). Details concerning the item pool are provided in this chapter. The item pool used in the 2018-19 summative assessment was large and, although relatively difficult compared to the students assessed, supported the delivery of reliable CAT tests, met blueprint requirements, and did not overexpose items. These outcomes support the conclusion that the 2018-19 summative assessment was well designed.