Performance and Measurement Precision Using the Adjusted Blueprint
Introduction
This chapter addresses student performance and operational test functioning with regard to precision and reliability when the adjusted (shortened) blueprint was used for the 2023-24 administration year. Some states who used the adjusted blueprint permitted remote proctoring, so results are provided showing the numbers of tests completed in person versus remotely. Measurement bias from the simulations produced by Cambium Assessment are provided, along with reliability, classification accuracy, standard errors of measurement, and overall score and achievement level results based on student data provided by California, Washington, Delaware, Hawaii, Idaho, Oregon, and the U.S. Virgin Islands. High school results are not presented separately by grade in order to prevent test results from being associated with states.
Prior to 2022-2023, claim scores for individual students were not made available for reporting for the adjusted blueprint. For 2022-2023, states may have elected to report only a total score for the adjusted blueprint or report composite claim scores for ELA/literacy and mathematics with the understanding that preliminary validity data were collected beginning in September 2022 and will be ongoing thereafter. The adjusted blueprints were submitted for federal assessment peer review in June 2023 and were found by the Department of Education to meet the rigorous federal assessment peer review requirements for the general assessment of reading/language arts and mathematics in July 2025.
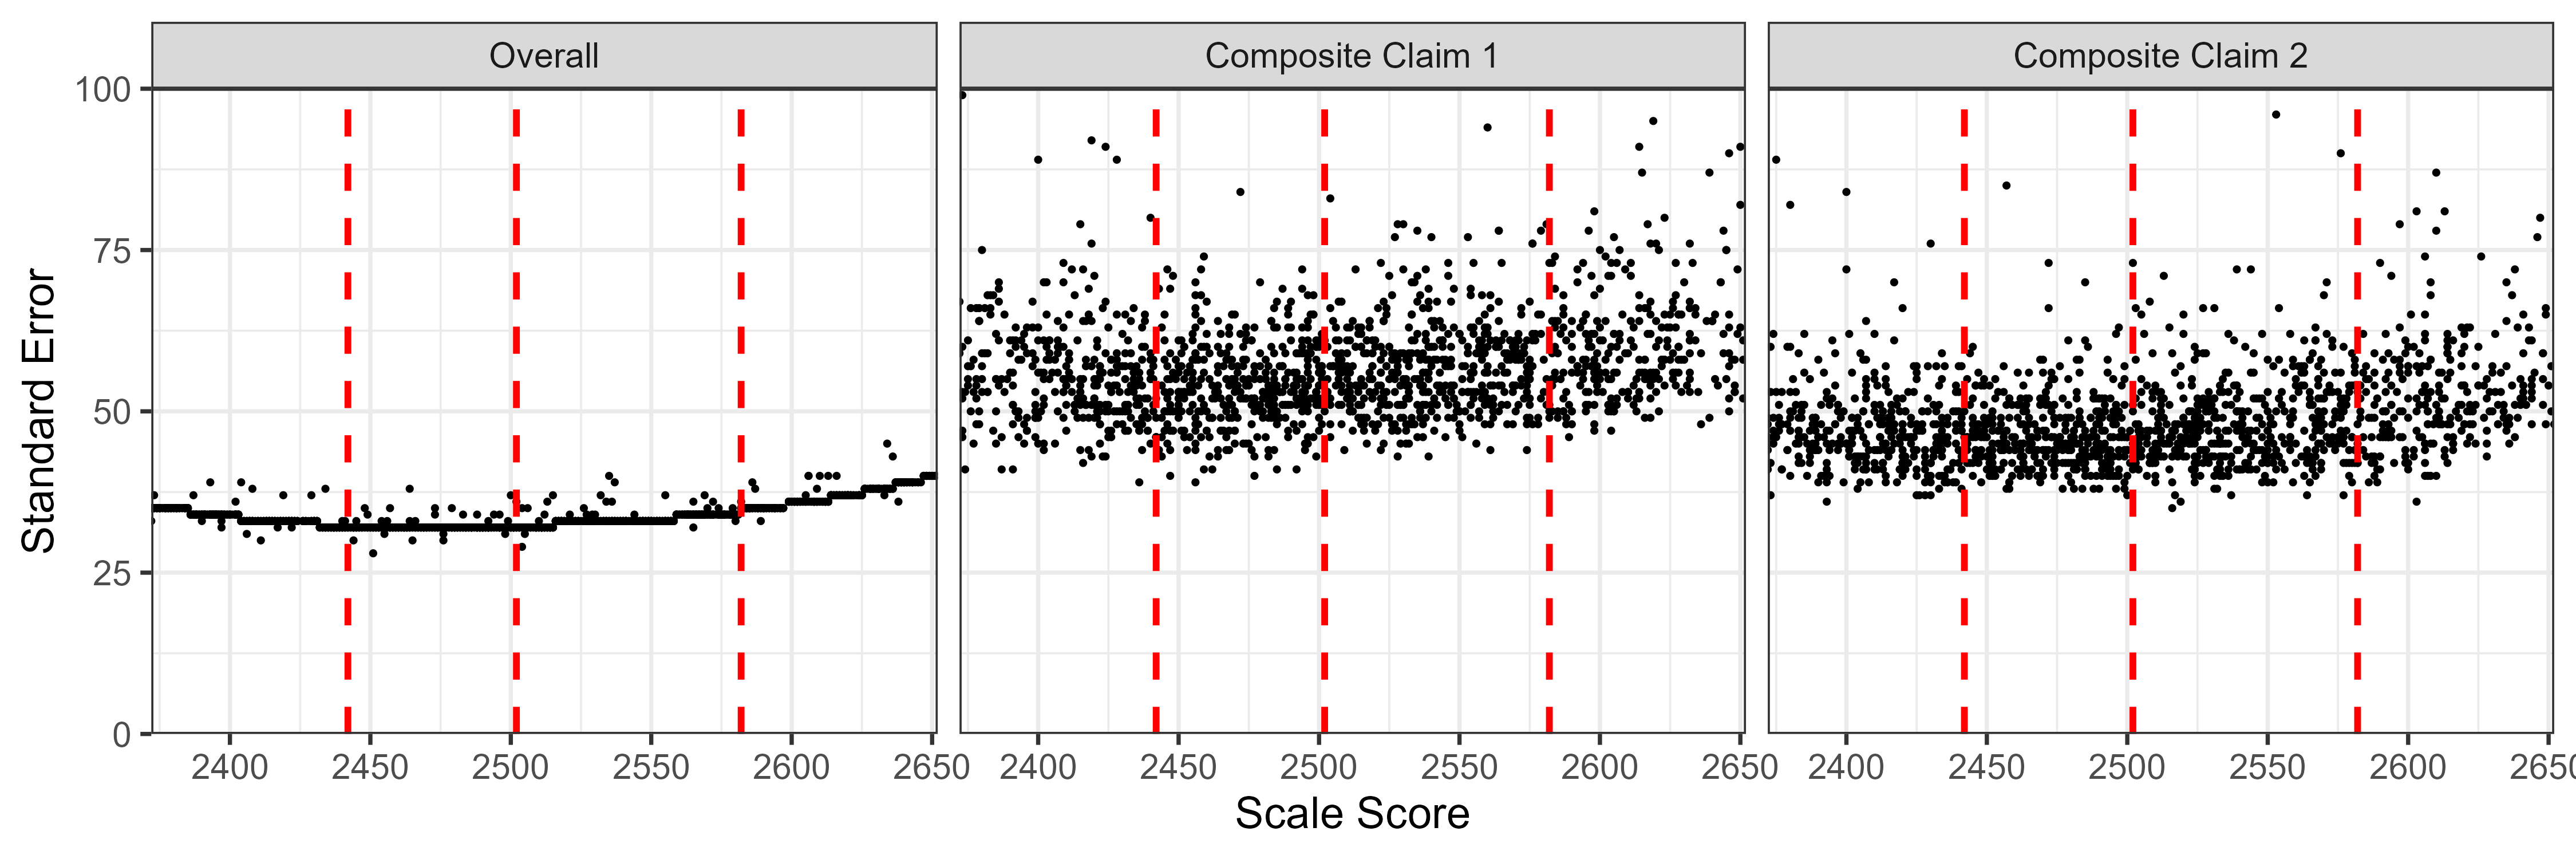
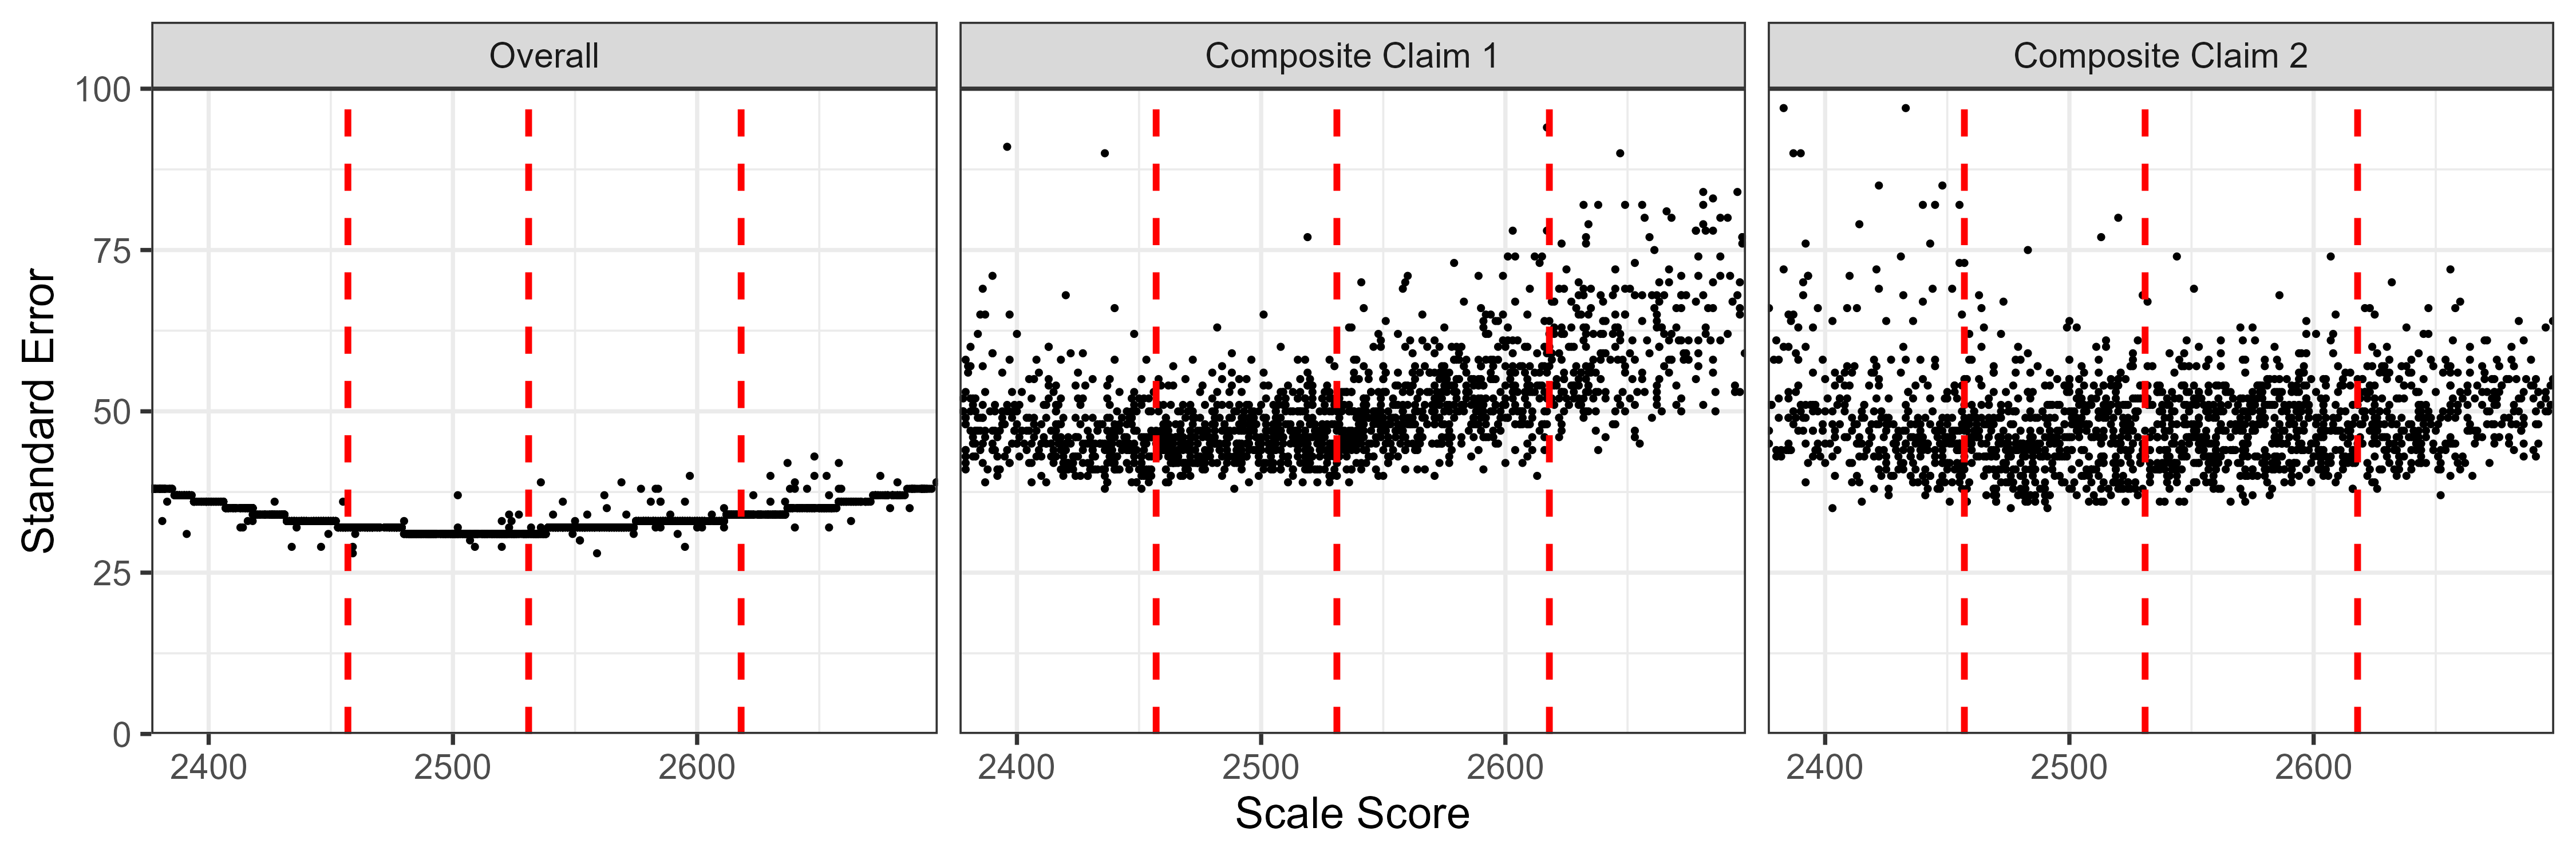
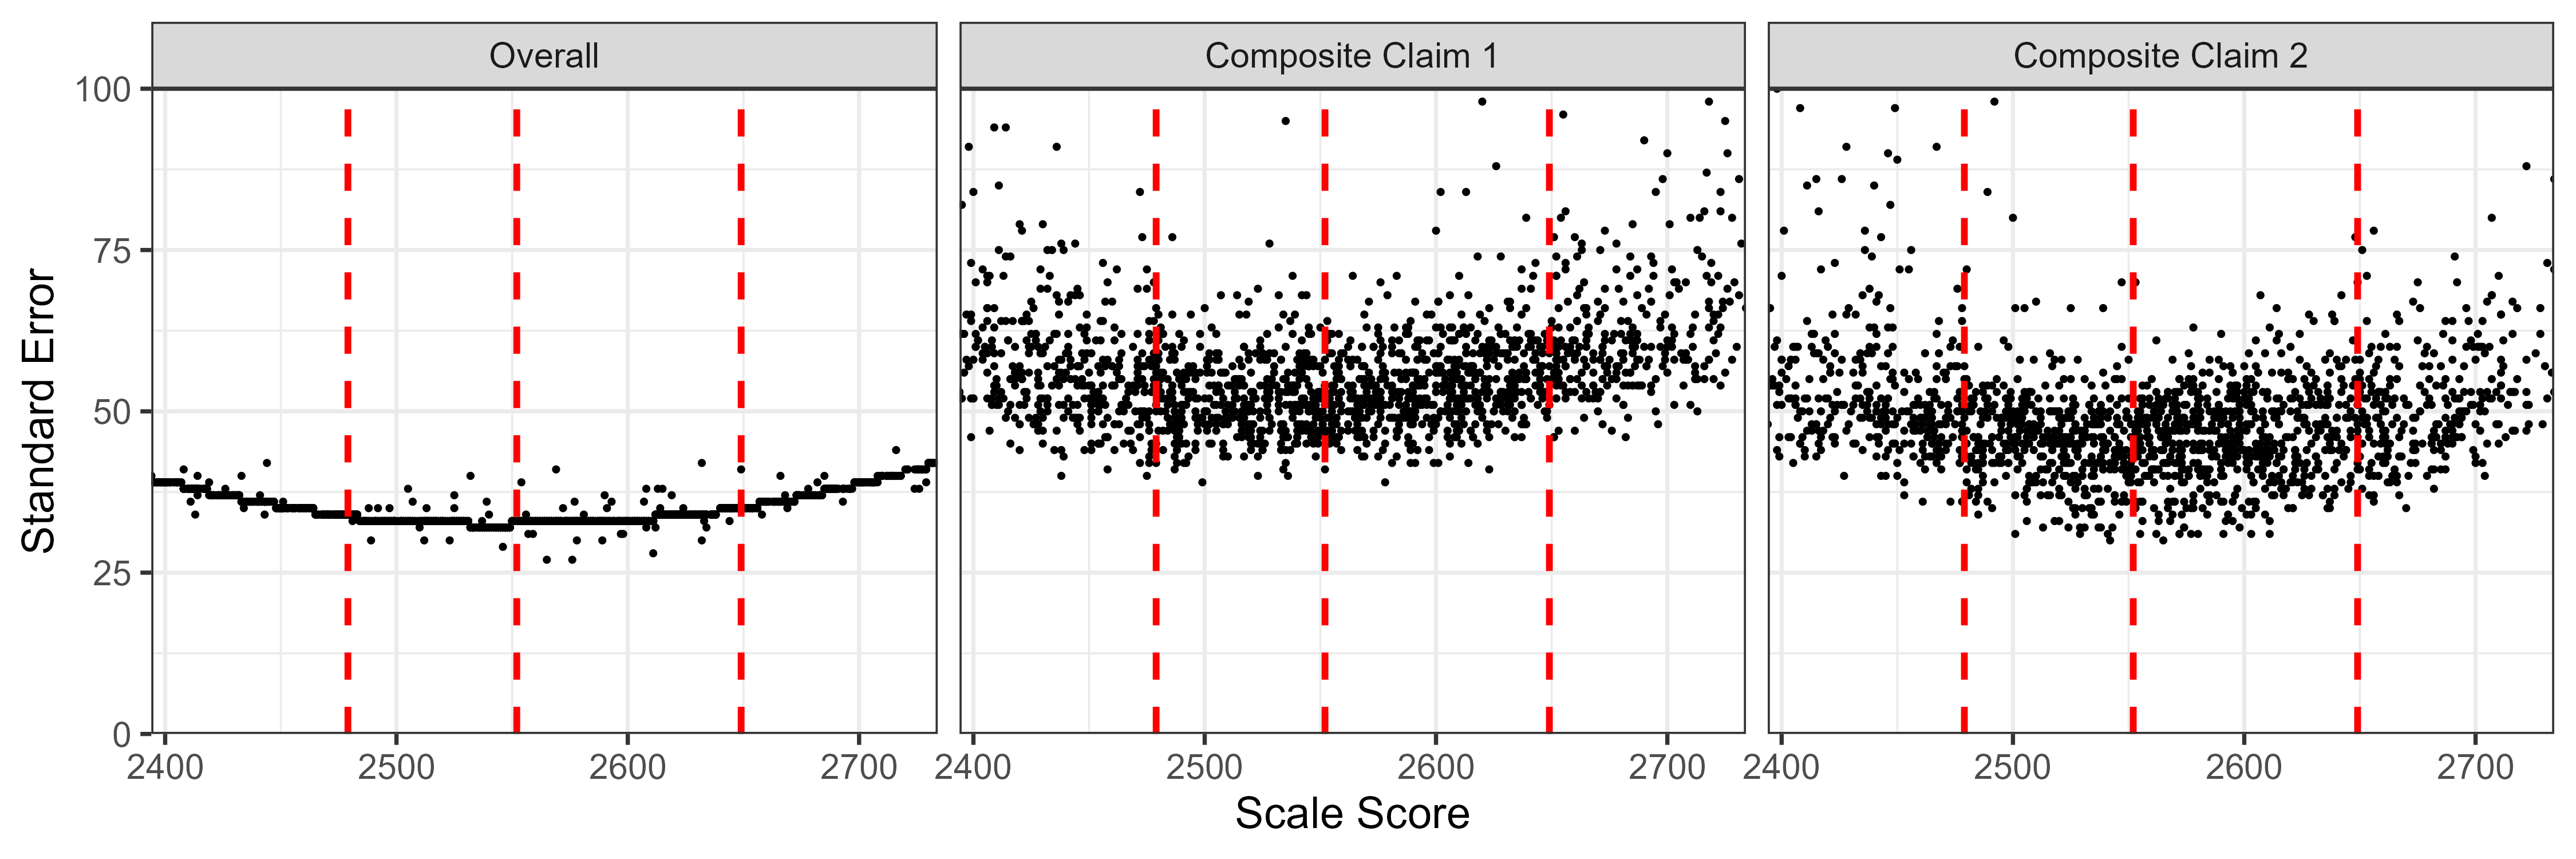
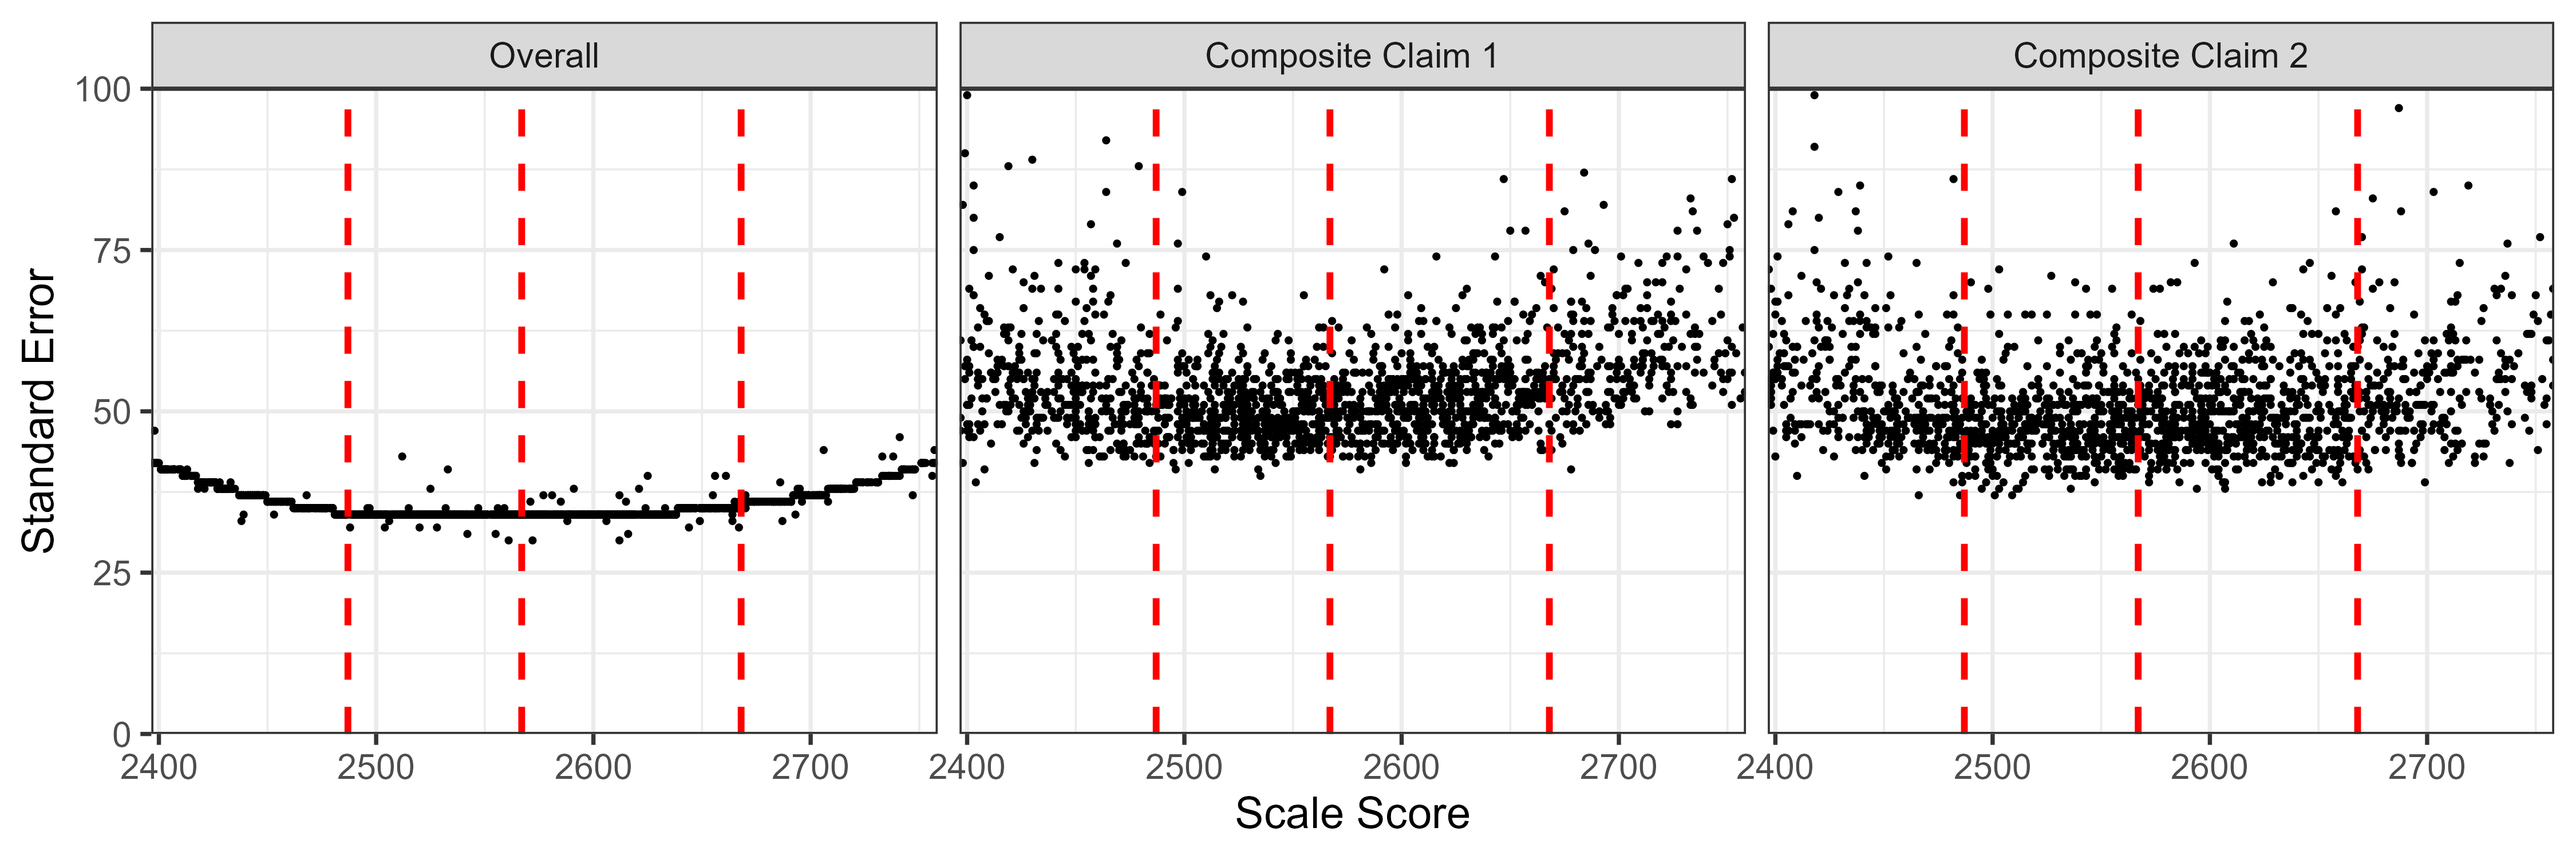
The composite claim scores are as follows:
ELA/literacy:
Mathematics:
Composite Claim 1: Concepts and Procedures
Composite Claim 2: Problem Solving, Communicating Reasoning, and Modeling and Data Analysis
For individual students taking the adjusted blueprint, claim scores are calculated using MLE, as described in the Smarter Balanced Test Scoring Specifications (Smarter Balanced, 2023b); however, the scores are based on the items contained in a particular claim or combination of claims.
Modes of Administration
Table 8.1 through Table 8.14 present counts of summative assessment administrations by mode (i.e., remote or in-person). All assessments based on the adjusted blueprint were administered online, without a paper/pencil option. These counts are presented at the aggregate level and disaggregated by gender, race/ethnicity, and various status flags: English learners (EL status), IDEA indicator, Section 504, and economically disadvantaged.
Table 8.1: COUNT OF GRADE 3 ELA/LITERACY ADMINISTRATIONS BY MODE FOR SELECTED DEMOGRAPHIC GROUPS
|
Group
|
Total
N
|
Remote
N
|
Remote
P
|
In-Person
N
|
In-Person
P
|
|
Total
|
561,435
|
417
|
0.1
|
561,018
|
99.9
|
|
Female
|
257,137
|
1
|
0.0
|
257,136
|
100.0
|
|
Male
|
285,915
|
220
|
0.1
|
285,695
|
99.9
|
|
Native American or Alaska Native
|
5,725
|
19
|
0.3
|
5,706
|
99.7
|
|
Asian
|
55,750
|
27
|
0.0
|
55,723
|
100.0
|
|
Black/African American
|
29,215
|
34
|
0.1
|
29,181
|
99.9
|
|
Native Hawaiian or Pacific Islander
|
6,742
|
20
|
0.3
|
6,722
|
99.7
|
|
Hispanic/Latino Ethnicity
|
261,184
|
81
|
0.0
|
261,103
|
100.0
|
|
White
|
176,701
|
375
|
0.2
|
176,326
|
99.8
|
|
Two or More Races
|
35,476
|
0
|
0.0
|
35,476
|
100.0
|
|
Unidentified Race
|
31,334
|
121
|
0.4
|
31,213
|
99.6
|
|
EL status
|
115,453
|
13
|
0.0
|
115,440
|
100.0
|
|
IDEA Indicator
|
78,324
|
53
|
0.1
|
78,271
|
99.9
|
|
Section 504 Status
|
10,707
|
9
|
0.1
|
10,698
|
99.9
|
|
Economic Disadvantage Status
|
310,148
|
220
|
0.1
|
309,928
|
99.9
|
Table 8.2: COUNT OF GRADE 4 ELA/LITERACY ADMINISTRATIONS BY MODE FOR SELECTED DEMOGRAPHIC GROUPS
|
Group
|
Total
N
|
Remote
N
|
Remote
P
|
In-Person
N
|
In-Person
P
|
|
Total
|
576,317
|
430
|
0.1
|
575,887
|
99.9
|
|
Female
|
263,059
|
7
|
0.0
|
263,052
|
100.0
|
|
Male
|
294,202
|
231
|
0.1
|
293,971
|
99.9
|
|
Native American or Alaska Native
|
6,335
|
22
|
0.3
|
6,313
|
99.7
|
|
Asian
|
56,223
|
35
|
0.1
|
56,188
|
99.9
|
|
Black/African American
|
30,628
|
33
|
0.1
|
30,595
|
99.9
|
|
Native Hawaiian or Pacific Islander
|
7,083
|
21
|
0.3
|
7,062
|
99.7
|
|
Hispanic/Latino Ethnicity
|
267,053
|
78
|
0.0
|
266,975
|
100.0
|
|
White
|
183,083
|
378
|
0.2
|
182,705
|
99.8
|
|
Two or More Races
|
35,328
|
0
|
0.0
|
35,328
|
100.0
|
|
Unidentified Race
|
32,197
|
124
|
0.4
|
32,073
|
99.6
|
|
EL status
|
111,051
|
16
|
0.0
|
111,035
|
100.0
|
|
IDEA Indicator
|
82,547
|
53
|
0.1
|
82,494
|
99.9
|
|
Section 504 Status
|
13,514
|
9
|
0.1
|
13,505
|
99.9
|
|
Economic Disadvantage Status
|
318,801
|
231
|
0.1
|
318,570
|
99.9
|
Table 8.3: COUNT OF GRADE 5 ELA/LITERACY ADMINISTRATIONS BY MODE FOR SELECTED DEMOGRAPHIC GROUPS
|
Group
|
Total
N
|
Remote
N
|
Remote
P
|
In-Person
N
|
In-Person
P
|
|
Total
|
582,912
|
500
|
0.1
|
582,412
|
99.9
|
|
Female
|
266,594
|
4
|
0.0
|
266,590
|
100.0
|
|
Male
|
297,343
|
260
|
0.1
|
297,083
|
99.9
|
|
Native American or Alaska Native
|
6,468
|
34
|
0.5
|
6,434
|
99.5
|
|
Asian
|
58,533
|
41
|
0.1
|
58,492
|
99.9
|
|
Black/African American
|
31,546
|
37
|
0.1
|
31,509
|
99.9
|
|
Native Hawaiian or Pacific Islander
|
7,098
|
17
|
0.2
|
7,081
|
99.8
|
|
Hispanic/Latino Ethnicity
|
270,091
|
69
|
0.0
|
270,022
|
100.0
|
|
White
|
182,990
|
451
|
0.2
|
182,539
|
99.8
|
|
Two or More Races
|
34,510
|
0
|
0.0
|
34,510
|
100.0
|
|
Unidentified Race
|
32,977
|
128
|
0.4
|
32,849
|
99.6
|
|
EL status
|
98,076
|
18
|
0.0
|
98,058
|
100.0
|
|
IDEA Indicator
|
80,862
|
57
|
0.1
|
80,805
|
99.9
|
|
Section 504 Status
|
15,895
|
14
|
0.1
|
15,881
|
99.9
|
|
Economic Disadvantage Status
|
323,002
|
247
|
0.1
|
322,755
|
99.9
|
Table 8.4: COUNT OF GRADE 6 ELA/LITERACY ADMINISTRATIONS BY MODE FOR SELECTED DEMOGRAPHIC GROUPS
|
Group
|
Total
N
|
Remote
N
|
Remote
P
|
In-Person
N
|
In-Person
P
|
|
Total
|
581,607
|
580
|
0.1
|
581,027
|
99.9
|
|
Female
|
265,831
|
5
|
0.0
|
265,826
|
100.0
|
|
Male
|
297,210
|
297
|
0.1
|
296,913
|
99.9
|
|
Native American or Alaska Native
|
6,302
|
41
|
0.7
|
6,261
|
99.3
|
|
Asian
|
57,409
|
33
|
0.1
|
57,376
|
99.9
|
|
Black/African American
|
31,446
|
35
|
0.1
|
31,411
|
99.9
|
|
Native Hawaiian or Pacific Islander
|
7,025
|
26
|
0.4
|
6,999
|
99.6
|
|
Hispanic/Latino Ethnicity
|
273,373
|
100
|
0.0
|
273,273
|
100.0
|
|
White
|
179,583
|
521
|
0.3
|
179,062
|
99.7
|
|
Two or More Races
|
33,072
|
0
|
0.0
|
33,072
|
100.0
|
|
Unidentified Race
|
34,286
|
155
|
0.5
|
34,131
|
99.5
|
|
EL status
|
87,383
|
28
|
0.0
|
87,355
|
100.0
|
|
IDEA Indicator
|
75,931
|
76
|
0.1
|
75,855
|
99.9
|
|
Section 504 Status
|
17,687
|
32
|
0.2
|
17,655
|
99.8
|
|
Economic Disadvantage Status
|
325,867
|
301
|
0.1
|
325,566
|
99.9
|
Table 8.5: COUNT OF GRADE 7 ELA/LITERACY ADMINISTRATIONS BY MODE FOR SELECTED DEMOGRAPHIC GROUPS
|
Group
|
Total
N
|
Remote
N
|
Remote
P
|
In-Person
N
|
In-Person
P
|
|
Total
|
585,493
|
787
|
0.1
|
584,706
|
99.9
|
|
Female
|
266,922
|
8
|
0.0
|
266,914
|
100.0
|
|
Male
|
300,205
|
385
|
0.1
|
299,820
|
99.9
|
|
Native American or Alaska Native
|
6,311
|
50
|
0.8
|
6,261
|
99.2
|
|
Asian
|
53,659
|
41
|
0.1
|
53,618
|
99.9
|
|
Black/African American
|
31,644
|
51
|
0.2
|
31,593
|
99.8
|
|
Native Hawaiian or Pacific Islander
|
6,747
|
32
|
0.5
|
6,715
|
99.5
|
|
Hispanic/Latino Ethnicity
|
276,103
|
146
|
0.1
|
275,957
|
99.9
|
|
White
|
174,347
|
703
|
0.4
|
173,644
|
99.6
|
|
Two or More Races
|
30,663
|
1
|
0.0
|
30,662
|
100.0
|
|
Unidentified Race
|
47,295
|
206
|
0.4
|
47,089
|
99.6
|
|
EL status
|
79,642
|
36
|
0.0
|
79,606
|
100.0
|
|
IDEA Indicator
|
73,396
|
113
|
0.2
|
73,283
|
99.8
|
|
Section 504 Status
|
19,462
|
41
|
0.2
|
19,421
|
99.8
|
|
Economic Disadvantage Status
|
327,263
|
406
|
0.1
|
326,857
|
99.9
|
Table 8.6: COUNT OF GRADE 8 ELA/LITERACY ADMINISTRATIONS BY MODE FOR SELECTED DEMOGRAPHIC GROUPS
|
Group
|
Total
N
|
Remote
N
|
Remote
P
|
In-Person
N
|
In-Person
P
|
|
Total
|
585,736
|
893
|
0.2
|
584,843
|
99.8
|
|
Female
|
266,664
|
4
|
0.0
|
266,660
|
100.0
|
|
Male
|
300,897
|
426
|
0.1
|
300,471
|
99.9
|
|
Native American or Alaska Native
|
6,205
|
72
|
1.2
|
6,133
|
98.8
|
|
Asian
|
52,108
|
56
|
0.1
|
52,052
|
99.9
|
|
Black/African American
|
30,616
|
60
|
0.2
|
30,556
|
99.8
|
|
Native Hawaiian or Pacific Islander
|
6,629
|
31
|
0.5
|
6,598
|
99.5
|
|
Hispanic/Latino Ethnicity
|
271,511
|
184
|
0.1
|
271,327
|
99.9
|
|
White
|
165,425
|
800
|
0.5
|
164,625
|
99.5
|
|
Two or More Races
|
28,072
|
1
|
0.0
|
28,071
|
100.0
|
|
Unidentified Race
|
65,848
|
269
|
0.4
|
65,579
|
99.6
|
|
EL status
|
68,876
|
38
|
0.1
|
68,838
|
99.9
|
|
IDEA Indicator
|
70,650
|
149
|
0.2
|
70,501
|
99.8
|
|
Section 504 Status
|
20,808
|
34
|
0.2
|
20,774
|
99.8
|
|
Economic Disadvantage Status
|
326,763
|
489
|
0.1
|
326,274
|
99.9
|
Table 8.7: COUNT OF HIGH SCHOOL ELA/LITERACY ADMINISTRATIONS BY MODE FOR SELECTED DEMOGRAPHIC GROUPS
|
Group
|
Total
N
|
Remote
N
|
Remote
P
|
In-Person
N
|
In-Person
P
|
|
Total
|
590,020
|
704
|
0.1
|
589,316
|
99.9
|
|
Female
|
271,059
|
2
|
0.0
|
271,057
|
100.0
|
|
Male
|
303,414
|
303
|
0.1
|
303,111
|
99.9
|
|
Native American or Alaska Native
|
5,509
|
37
|
0.7
|
5,472
|
99.3
|
|
Asian
|
49,679
|
48
|
0.1
|
49,631
|
99.9
|
|
Black/African American
|
23,879
|
39
|
0.2
|
23,840
|
99.8
|
|
Native Hawaiian or Pacific Islander
|
5,090
|
16
|
0.3
|
5,074
|
99.7
|
|
Hispanic/Latino Ethnicity
|
262,828
|
150
|
0.1
|
262,678
|
99.9
|
|
White
|
136,654
|
629
|
0.5
|
136,025
|
99.5
|
|
Two or More Races
|
22,292
|
0
|
0.0
|
22,292
|
100.0
|
|
Unidentified Race
|
113,397
|
200
|
0.2
|
113,197
|
99.8
|
|
EL status
|
62,191
|
26
|
0.0
|
62,165
|
100.0
|
|
IDEA Indicator
|
65,082
|
89
|
0.1
|
64,993
|
99.9
|
|
Section 504 Status
|
26,860
|
58
|
0.2
|
26,802
|
99.8
|
|
Economic Disadvantage Status
|
329,559
|
367
|
0.1
|
329,192
|
99.9
|
Table 8.8: COUNT OF GRADE 3 MATHEMATICS ADMINISTRATIONS BY MODE FOR SELECTED DEMOGRAPHIC GROUPS
|
Group
|
Total
N
|
Remote
N
|
Remote
P
|
In-Person
N
|
In-Person
P
|
|
Total
|
567,862
|
405
|
0.1
|
567,457
|
99.9
|
|
Female
|
260,111
|
1
|
0.0
|
260,110
|
100.0
|
|
Male
|
289,235
|
214
|
0.1
|
289,021
|
99.9
|
|
Native American or Alaska Native
|
5,751
|
19
|
0.3
|
5,732
|
99.7
|
|
Asian
|
56,882
|
25
|
0.0
|
56,857
|
100.0
|
|
Black/African American
|
29,284
|
31
|
0.1
|
29,253
|
99.9
|
|
Native Hawaiian or Pacific Islander
|
6,776
|
19
|
0.3
|
6,757
|
99.7
|
|
Hispanic/Latino Ethnicity
|
265,058
|
78
|
0.0
|
264,980
|
100.0
|
|
White
|
177,632
|
366
|
0.2
|
177,266
|
99.8
|
|
Two or More Races
|
35,585
|
0
|
0.0
|
35,585
|
100.0
|
|
Unidentified Race
|
32,372
|
115
|
0.4
|
32,257
|
99.6
|
|
EL status
|
122,309
|
13
|
0.0
|
122,296
|
100.0
|
|
IDEA Indicator
|
78,322
|
54
|
0.1
|
78,268
|
99.9
|
|
Section 504 Status
|
10,801
|
9
|
0.1
|
10,792
|
99.9
|
|
Economic Disadvantage Status
|
314,132
|
210
|
0.1
|
313,922
|
99.9
|
Table 8.9: COUNT OF GRADE 4 MATHEMATICS ADMINISTRATIONS BY MODE FOR SELECTED DEMOGRAPHIC GROUPS
|
Group
|
Total
N
|
Remote
N
|
Remote
P
|
In-Person
N
|
In-Person
P
|
|
Total
|
582,267
|
432
|
0.1
|
581,835
|
99.9
|
|
Female
|
265,746
|
7
|
0.0
|
265,739
|
100.0
|
|
Male
|
297,391
|
231
|
0.1
|
297,160
|
99.9
|
|
Native American or Alaska Native
|
6,378
|
24
|
0.4
|
6,354
|
99.6
|
|
Asian
|
57,247
|
37
|
0.1
|
57,210
|
99.9
|
|
Black/African American
|
30,662
|
34
|
0.1
|
30,628
|
99.9
|
|
Native Hawaiian or Pacific Islander
|
7,115
|
22
|
0.3
|
7,093
|
99.7
|
|
Hispanic/Latino Ethnicity
|
270,765
|
79
|
0.0
|
270,686
|
100.0
|
|
White
|
183,869
|
379
|
0.2
|
183,490
|
99.8
|
|
Two or More Races
|
35,452
|
0
|
0.0
|
35,452
|
100.0
|
|
Unidentified Race
|
33,190
|
124
|
0.4
|
33,066
|
99.6
|
|
EL status
|
117,500
|
17
|
0.0
|
117,483
|
100.0
|
|
IDEA Indicator
|
82,452
|
53
|
0.1
|
82,399
|
99.9
|
|
Section 504 Status
|
13,573
|
10
|
0.1
|
13,563
|
99.9
|
|
Economic Disadvantage Status
|
322,356
|
231
|
0.1
|
322,125
|
99.9
|
Table 8.10: COUNT OF GRADE 5 MATHEMATICS ADMINISTRATIONS BY MODE FOR SELECTED DEMOGRAPHIC GROUPS
|
Group
|
Total
N
|
Remote
N
|
Remote
P
|
In-Person
N
|
In-Person
P
|
|
Total
|
588,105
|
509
|
0.1
|
587,596
|
99.9
|
|
Female
|
268,926
|
4
|
0.0
|
268,922
|
100.0
|
|
Male
|
300,124
|
270
|
0.1
|
299,854
|
99.9
|
|
Native American or Alaska Native
|
6,490
|
33
|
0.5
|
6,457
|
99.5
|
|
Asian
|
59,441
|
42
|
0.1
|
59,399
|
99.9
|
|
Black/African American
|
31,578
|
39
|
0.1
|
31,539
|
99.9
|
|
Native Hawaiian or Pacific Islander
|
7,110
|
17
|
0.2
|
7,093
|
99.8
|
|
Hispanic/Latino Ethnicity
|
273,312
|
72
|
0.0
|
273,240
|
100.0
|
|
White
|
183,561
|
460
|
0.3
|
183,101
|
99.7
|
|
Two or More Races
|
34,585
|
0
|
0.0
|
34,585
|
100.0
|
|
Unidentified Race
|
33,987
|
133
|
0.4
|
33,854
|
99.6
|
|
EL status
|
103,801
|
17
|
0.0
|
103,784
|
100.0
|
|
IDEA Indicator
|
80,792
|
61
|
0.1
|
80,731
|
99.9
|
|
Section 504 Status
|
15,983
|
14
|
0.1
|
15,969
|
99.9
|
|
Economic Disadvantage Status
|
326,154
|
254
|
0.1
|
325,900
|
99.9
|
Table 8.11: COUNT OF GRADE 6 MATHEMATICS ADMINISTRATIONS BY MODE FOR SELECTED DEMOGRAPHIC GROUPS
|
Group
|
Total
N
|
Remote
N
|
Remote
P
|
In-Person
N
|
In-Person
P
|
|
Total
|
585,884
|
587
|
0.1
|
585,297
|
99.9
|
|
Female
|
267,799
|
5
|
0.0
|
267,794
|
100.0
|
|
Male
|
299,452
|
295
|
0.1
|
299,157
|
99.9
|
|
Native American or Alaska Native
|
6,329
|
41
|
0.6
|
6,288
|
99.4
|
|
Asian
|
58,273
|
32
|
0.1
|
58,241
|
99.9
|
|
Black/African American
|
31,377
|
35
|
0.1
|
31,342
|
99.9
|
|
Native Hawaiian or Pacific Islander
|
7,050
|
25
|
0.4
|
7,025
|
99.6
|
|
Hispanic/Latino Ethnicity
|
276,213
|
104
|
0.0
|
276,109
|
100.0
|
|
White
|
180,008
|
530
|
0.3
|
179,478
|
99.7
|
|
Two or More Races
|
33,103
|
0
|
0.0
|
33,103
|
100.0
|
|
Unidentified Race
|
35,211
|
159
|
0.5
|
35,052
|
99.5
|
|
EL status
|
92,635
|
28
|
0.0
|
92,607
|
100.0
|
|
IDEA Indicator
|
75,650
|
80
|
0.1
|
75,570
|
99.9
|
|
Section 504 Status
|
17,722
|
31
|
0.2
|
17,691
|
99.8
|
|
Economic Disadvantage Status
|
328,577
|
308
|
0.1
|
328,269
|
99.9
|
Table 8.12: COUNT OF GRADE 7 MATHEMATICS ADMINISTRATIONS BY MODE FOR SELECTED DEMOGRAPHIC GROUPS
|
Group
|
Total
N
|
Remote
N
|
Remote
P
|
In-Person
N
|
In-Person
P
|
|
Total
|
588,474
|
789
|
0.1
|
587,685
|
99.9
|
|
Female
|
268,264
|
8
|
0.0
|
268,256
|
100.0
|
|
Male
|
301,906
|
390
|
0.1
|
301,516
|
99.9
|
|
Native American or Alaska Native
|
6,316
|
50
|
0.8
|
6,266
|
99.2
|
|
Asian
|
54,313
|
43
|
0.1
|
54,270
|
99.9
|
|
Black/African American
|
31,522
|
53
|
0.2
|
31,469
|
99.8
|
|
Native Hawaiian or Pacific Islander
|
6,770
|
31
|
0.5
|
6,739
|
99.5
|
|
Hispanic/Latino Ethnicity
|
278,217
|
146
|
0.1
|
278,071
|
99.9
|
|
White
|
174,446
|
705
|
0.4
|
173,741
|
99.6
|
|
Two or More Races
|
30,666
|
1
|
0.0
|
30,665
|
100.0
|
|
Unidentified Race
|
48,017
|
209
|
0.4
|
47,808
|
99.6
|
|
EL status
|
84,225
|
37
|
0.0
|
84,188
|
100.0
|
|
IDEA Indicator
|
73,004
|
116
|
0.2
|
72,888
|
99.8
|
|
Section 504 Status
|
19,461
|
40
|
0.2
|
19,421
|
99.8
|
|
Economic Disadvantage Status
|
329,006
|
413
|
0.1
|
328,593
|
99.9
|
Table 8.13: COUNT OF GRADE 8 MATHEMATICS ADMINISTRATIONS BY MODE FOR SELECTED DEMOGRAPHIC GROUPS
|
Group
|
Total
N
|
Remote
N
|
Remote
P
|
In-Person
N
|
In-Person
P
|
|
Total
|
588,081
|
861
|
0.1
|
587,220
|
99.9
|
|
Female
|
267,772
|
4
|
0.0
|
267,768
|
100.0
|
|
Male
|
302,265
|
418
|
0.1
|
301,847
|
99.9
|
|
Native American or Alaska Native
|
6,190
|
65
|
1.1
|
6,125
|
98.9
|
|
Asian
|
52,635
|
57
|
0.1
|
52,578
|
99.9
|
|
Black/African American
|
30,525
|
55
|
0.2
|
30,470
|
99.8
|
|
Native Hawaiian or Pacific Islander
|
6,645
|
32
|
0.5
|
6,613
|
99.5
|
|
Hispanic/Latino Ethnicity
|
273,231
|
178
|
0.1
|
273,053
|
99.9
|
|
White
|
165,360
|
774
|
0.5
|
164,586
|
99.5
|
|
Two or More Races
|
28,042
|
1
|
0.0
|
28,041
|
100.0
|
|
Unidentified Race
|
66,488
|
259
|
0.4
|
66,229
|
99.6
|
|
EL status
|
72,910
|
36
|
0.0
|
72,874
|
100.0
|
|
IDEA Indicator
|
70,275
|
139
|
0.2
|
70,136
|
99.8
|
|
Section 504 Status
|
20,819
|
32
|
0.2
|
20,787
|
99.8
|
|
Economic Disadvantage Status
|
327,973
|
478
|
0.1
|
327,495
|
99.9
|
Table 8.14: COUNT OF HIGH SCHOOL MATHEMATICS ADMINISTRATIONS BY MODE FOR SELECTED DEMOGRAPHIC GROUPS
|
Group
|
Total
N
|
Remote
N
|
Remote
P
|
In-Person
N
|
In-Person
P
|
|
Total
|
597,196
|
697
|
0.1
|
596,499
|
99.9
|
|
Female
|
275,514
|
2
|
0.0
|
275,512
|
100.0
|
|
Male
|
306,465
|
298
|
0.1
|
306,167
|
99.9
|
|
Native American or Alaska Native
|
5,435
|
39
|
0.7
|
5,396
|
99.3
|
|
Asian
|
49,689
|
46
|
0.1
|
49,643
|
99.9
|
|
Black/African American
|
23,599
|
39
|
0.2
|
23,560
|
99.8
|
|
Native Hawaiian or Pacific Islander
|
5,063
|
15
|
0.3
|
5,048
|
99.7
|
|
Hispanic/Latino Ethnicity
|
262,473
|
145
|
0.1
|
262,328
|
99.9
|
|
White
|
136,002
|
623
|
0.5
|
135,379
|
99.5
|
|
Two or More Races
|
22,212
|
0
|
0.0
|
22,212
|
100.0
|
|
Unidentified Race
|
121,636
|
193
|
0.2
|
121,443
|
99.8
|
|
EL status
|
64,229
|
24
|
0.0
|
64,205
|
100.0
|
|
IDEA Indicator
|
64,664
|
89
|
0.1
|
64,575
|
99.9
|
|
Section 504 Status
|
27,251
|
59
|
0.2
|
27,192
|
99.8
|
|
Economic Disadvantage Status
|
331,906
|
361
|
0.1
|
331,545
|
99.9
|
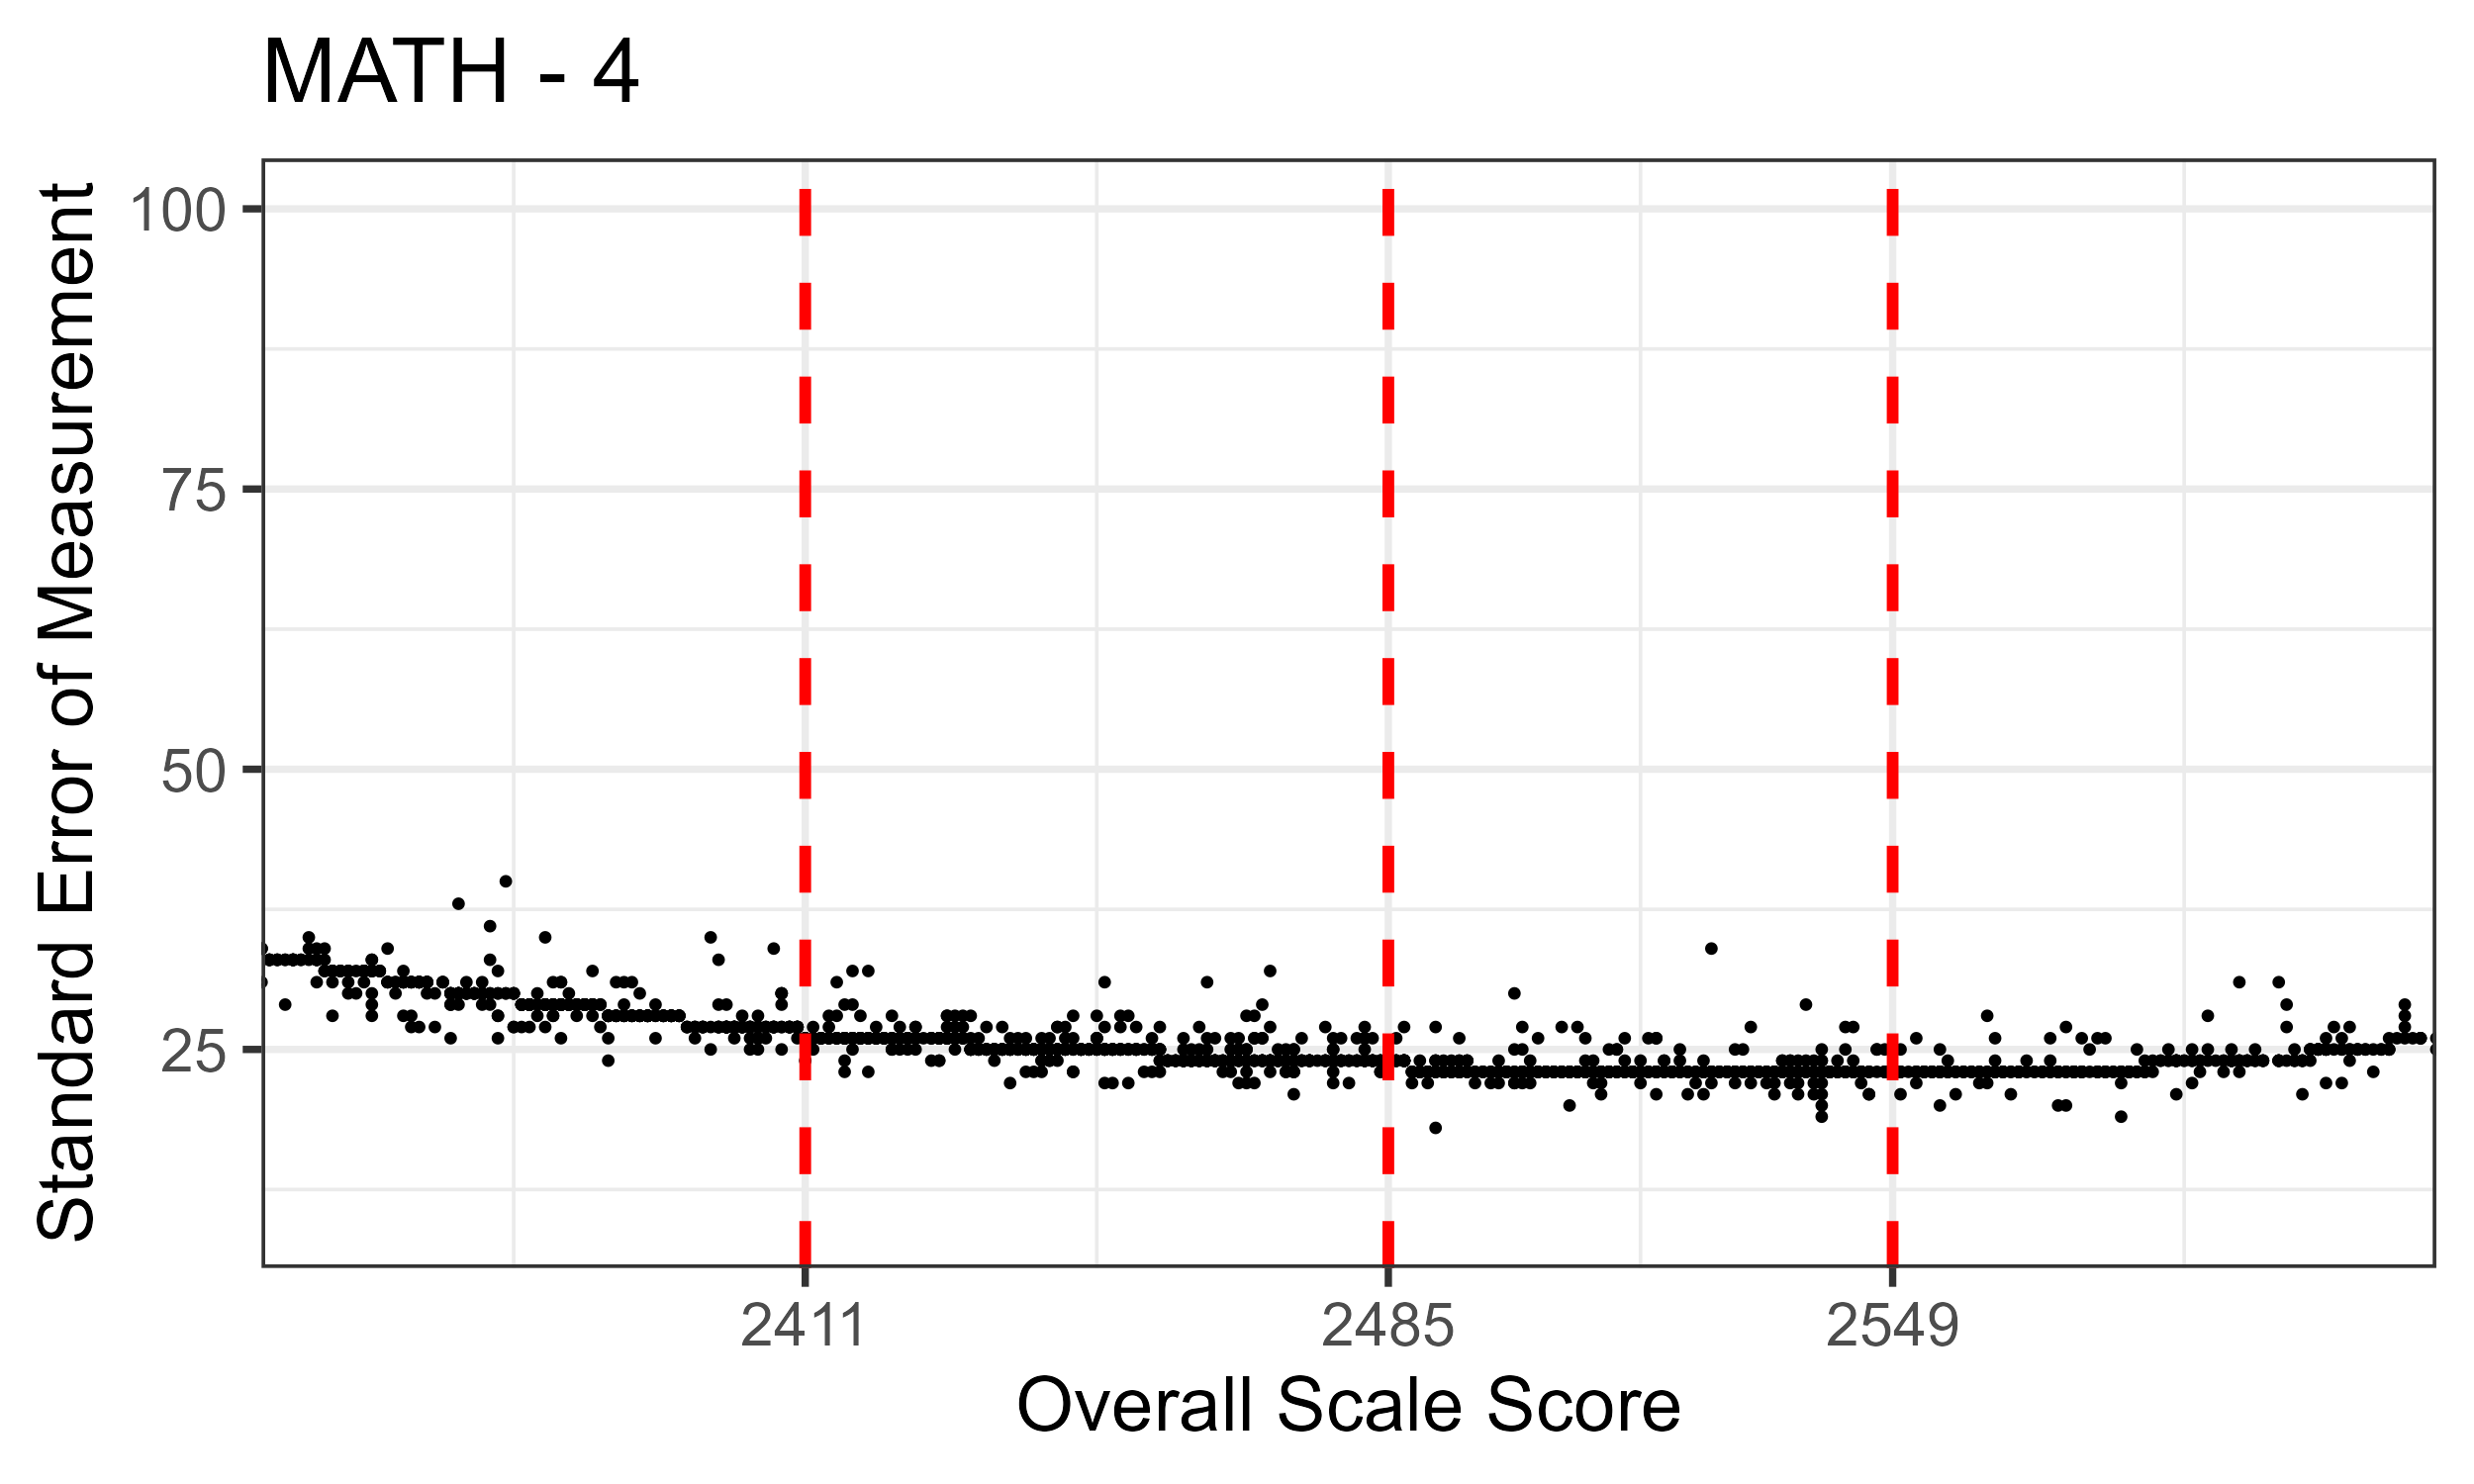
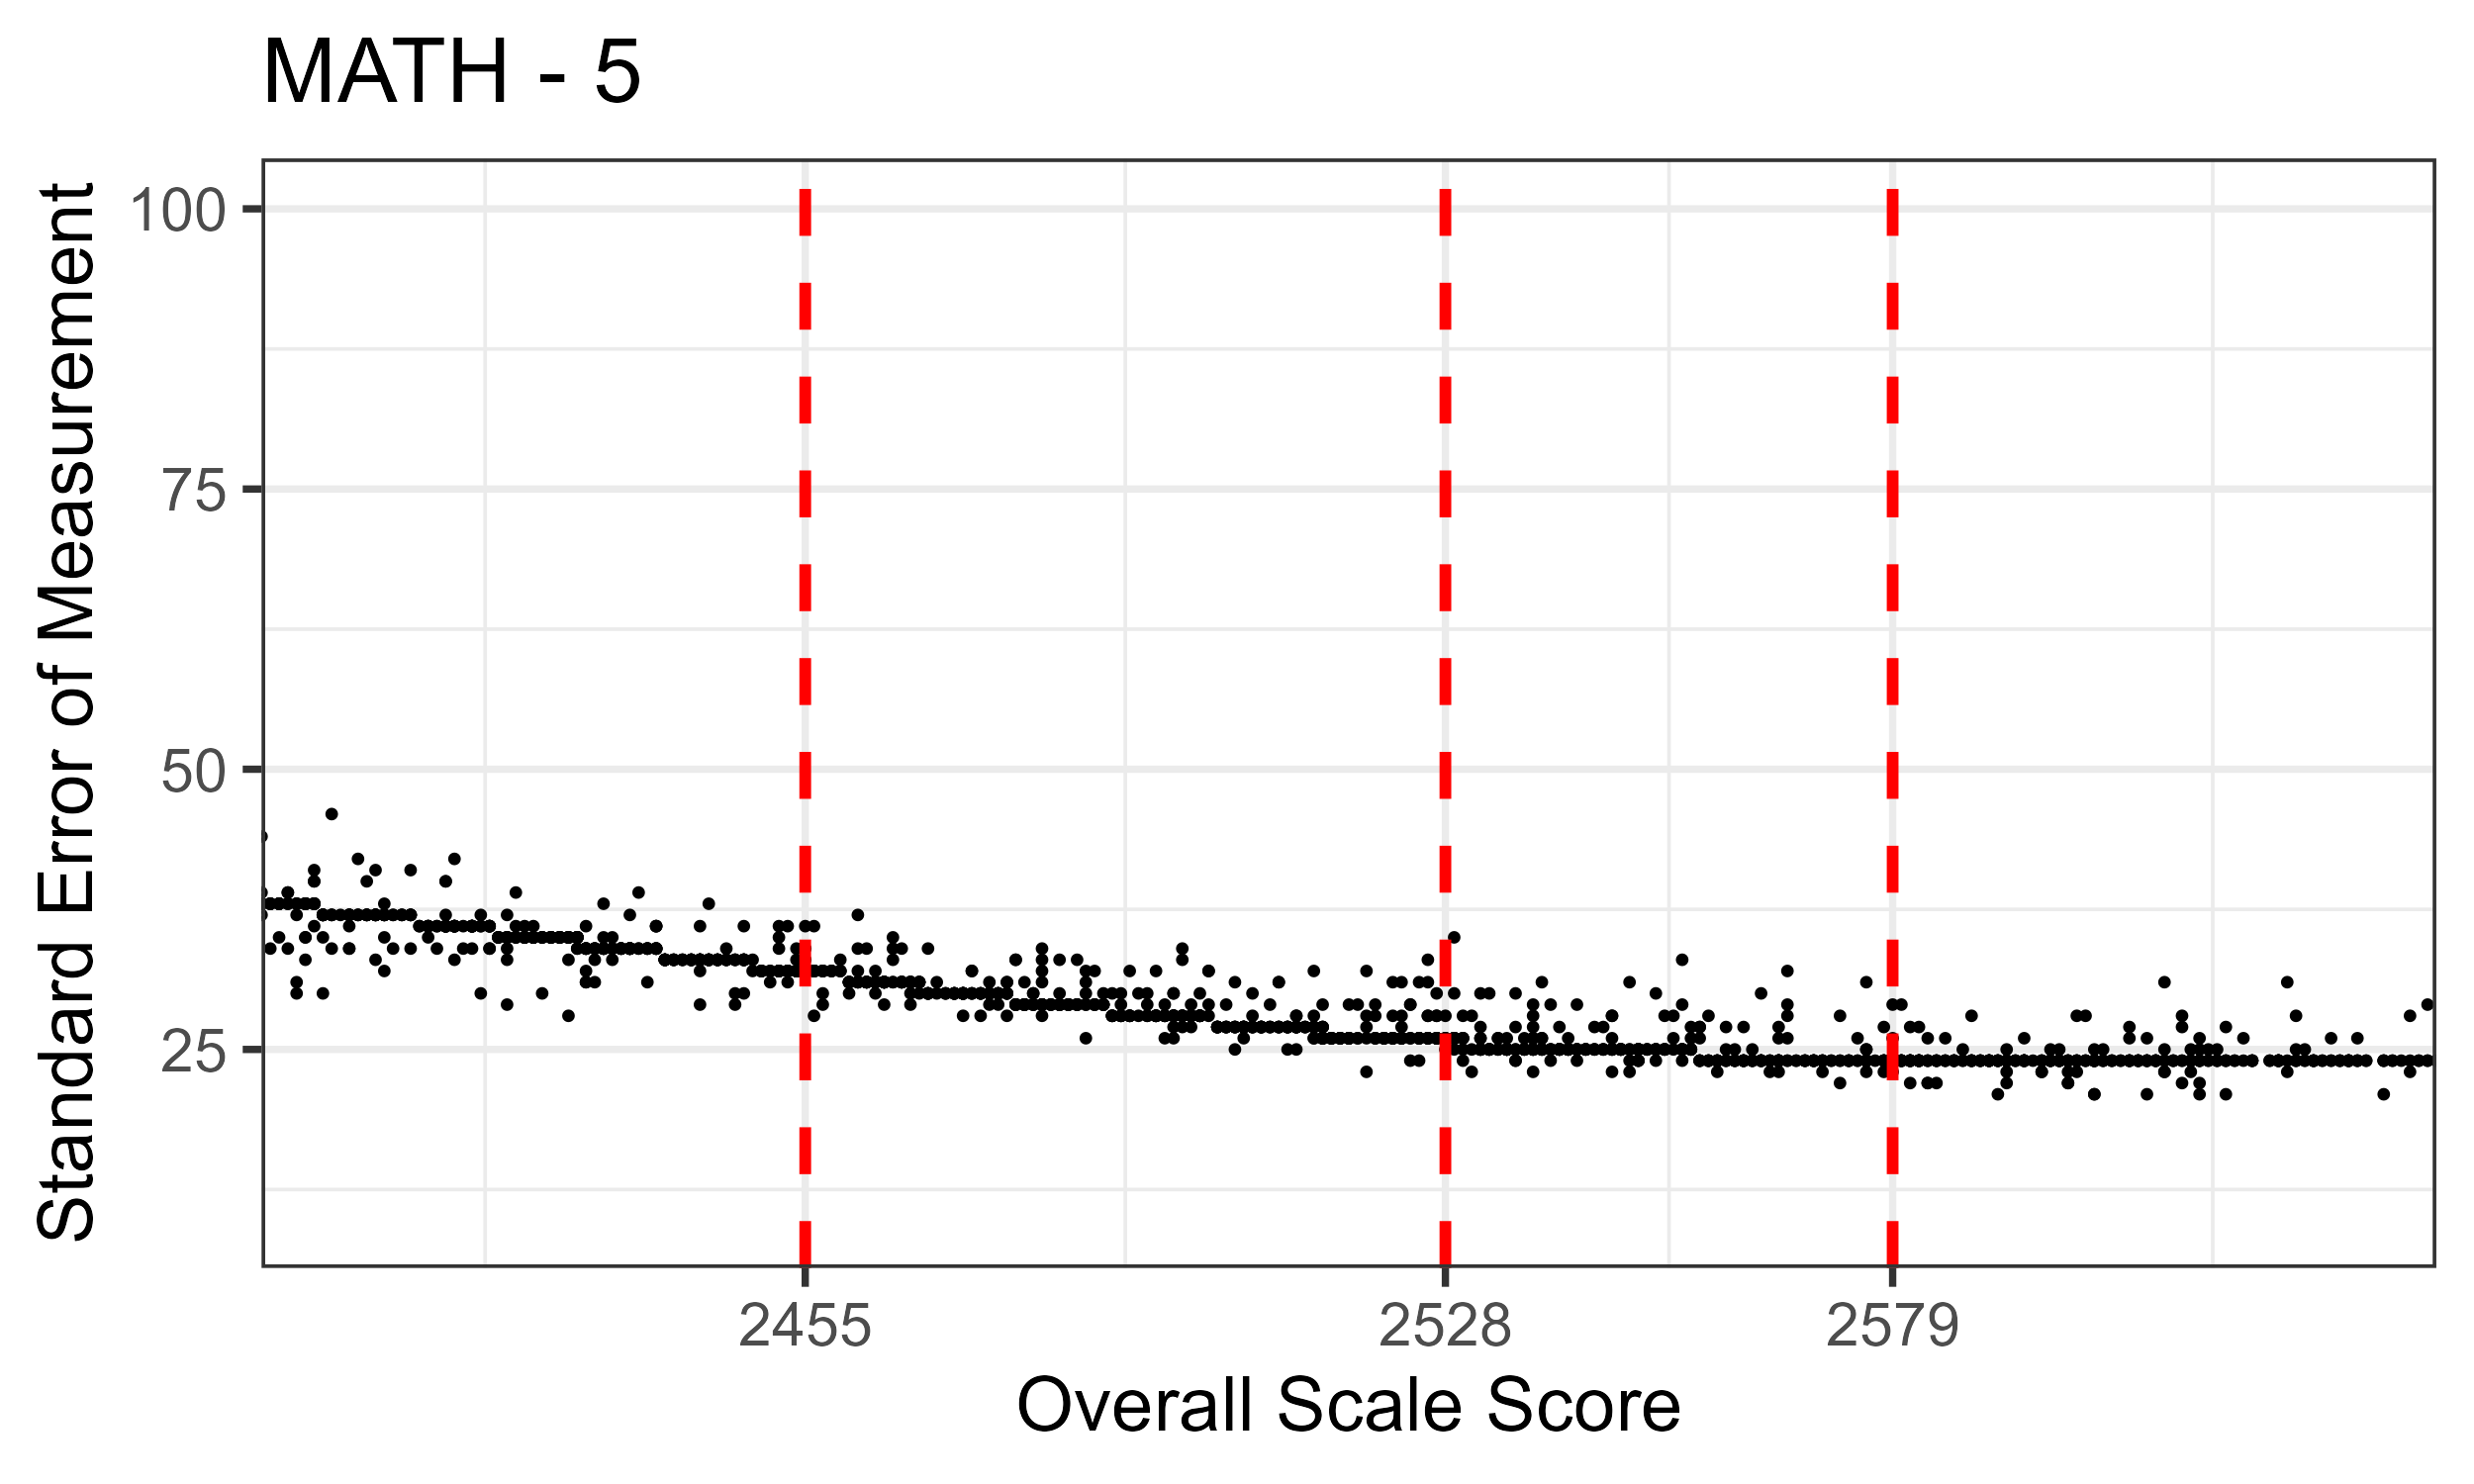
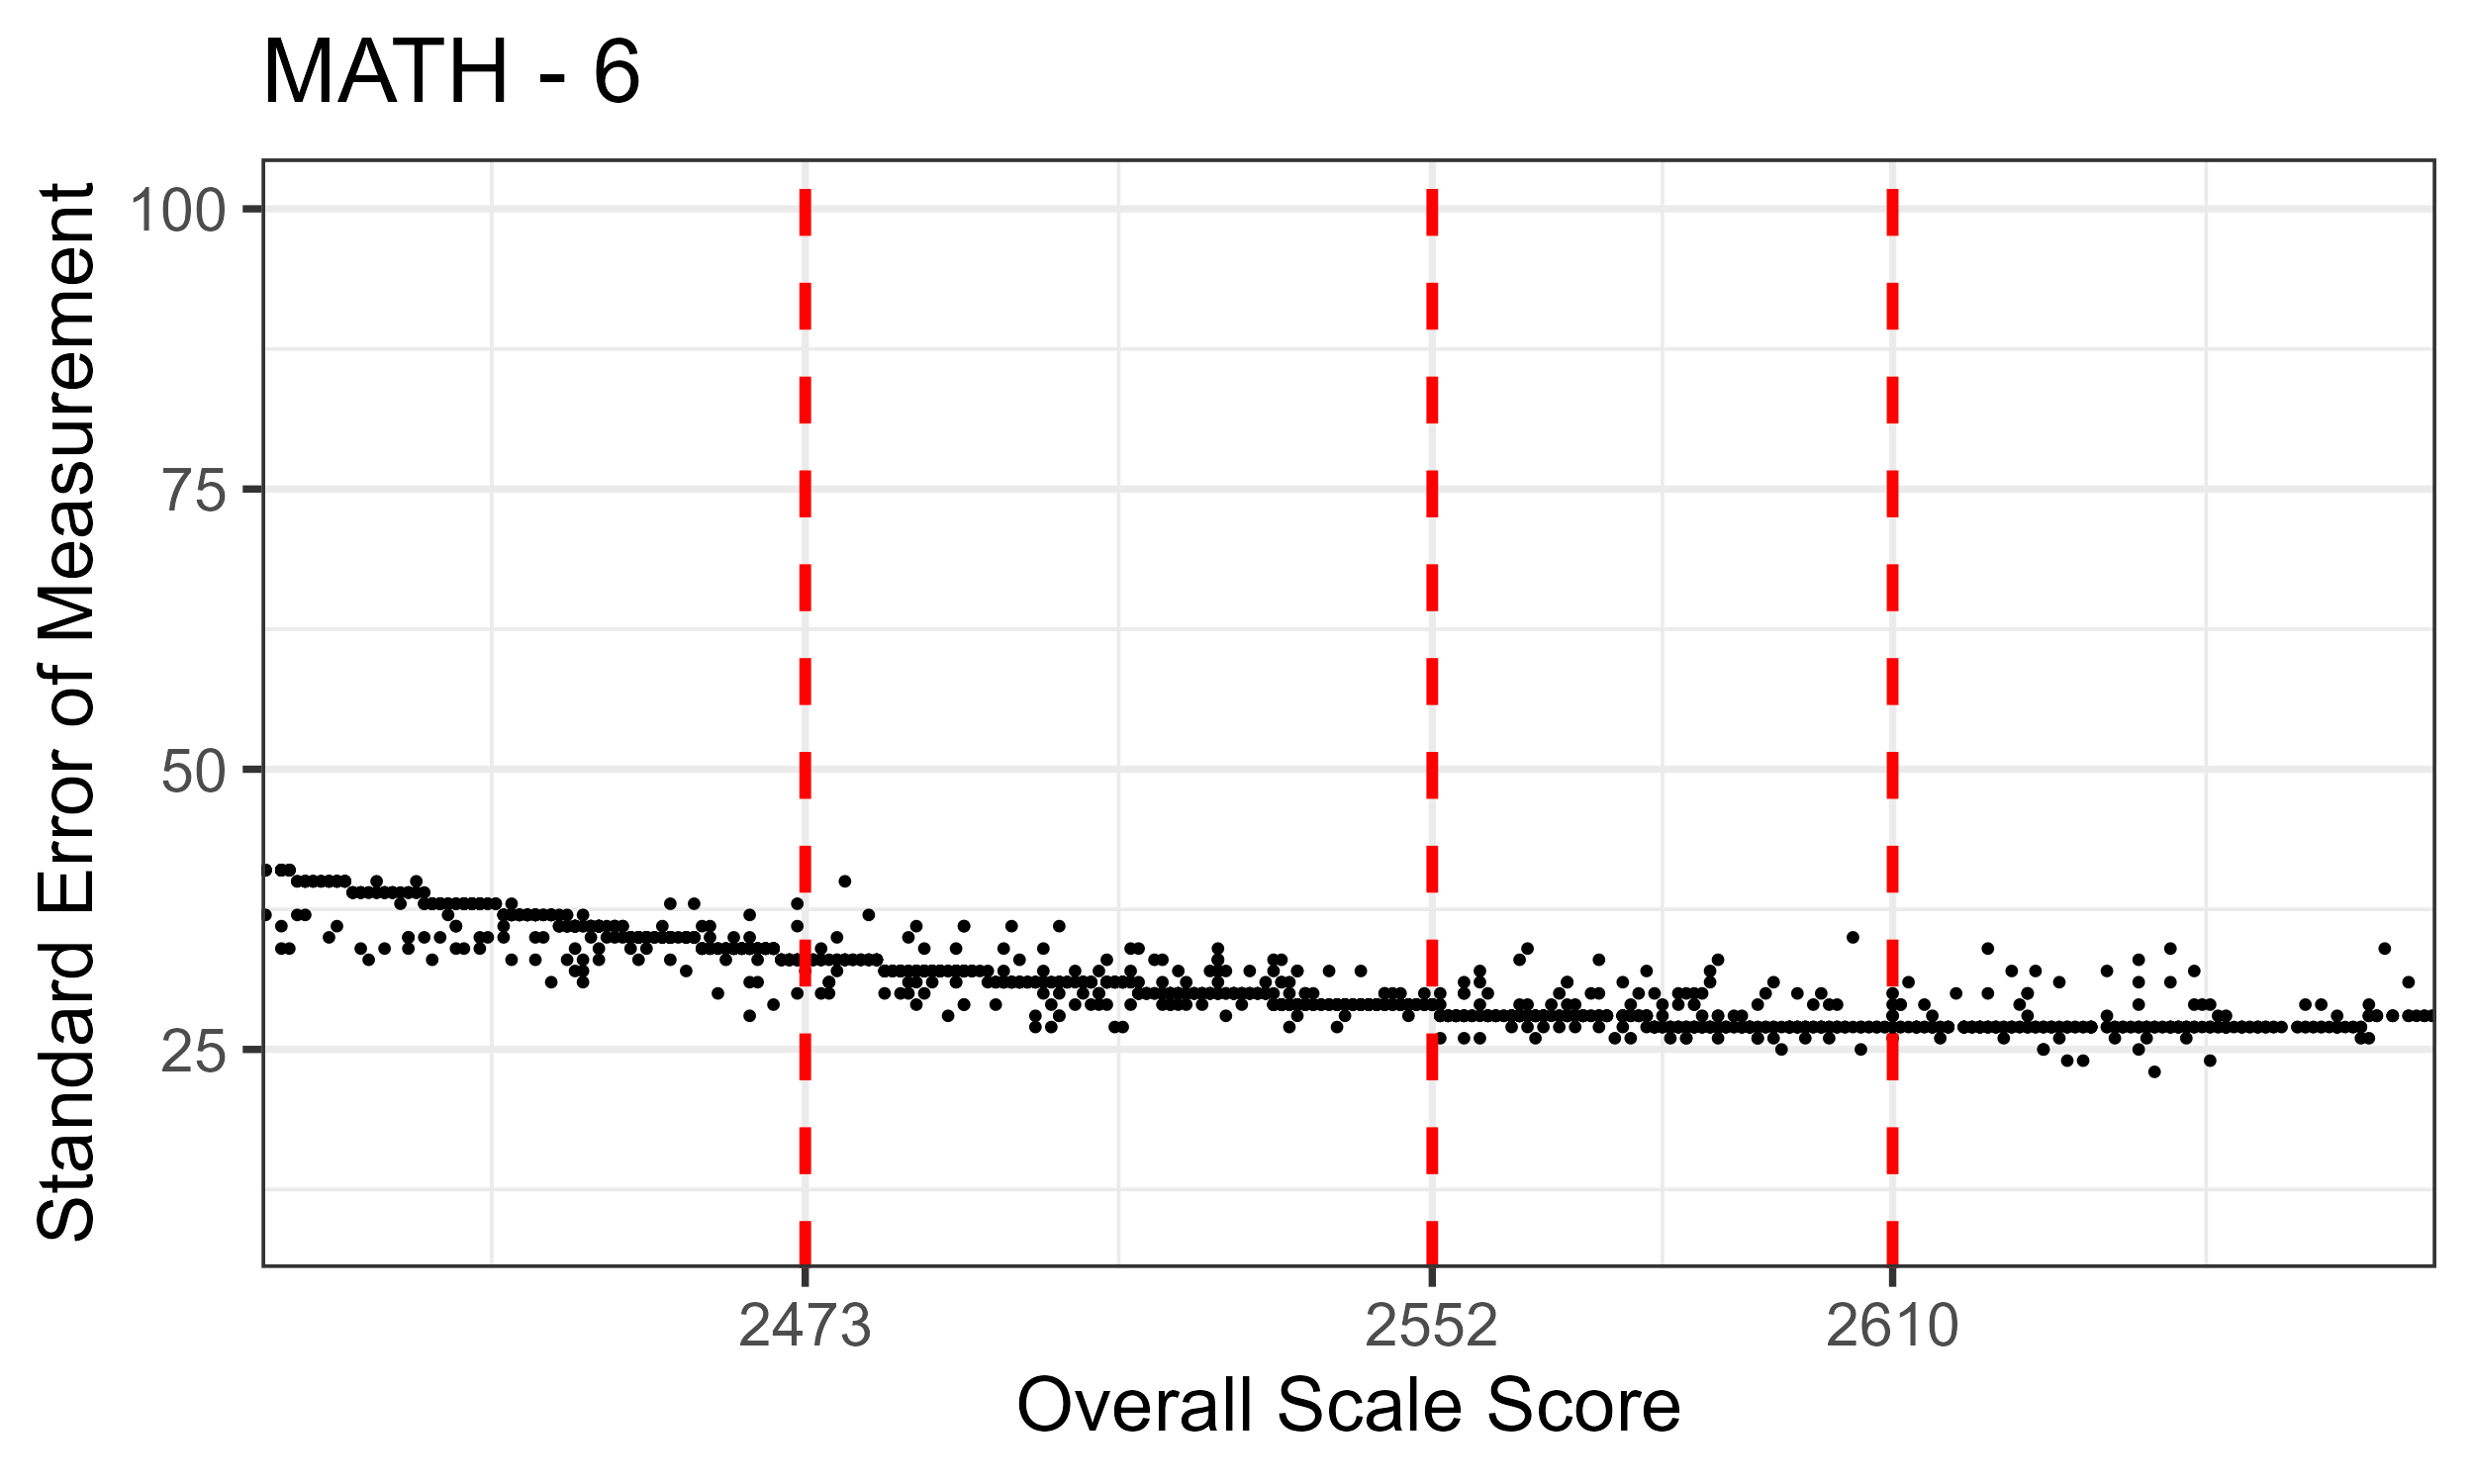
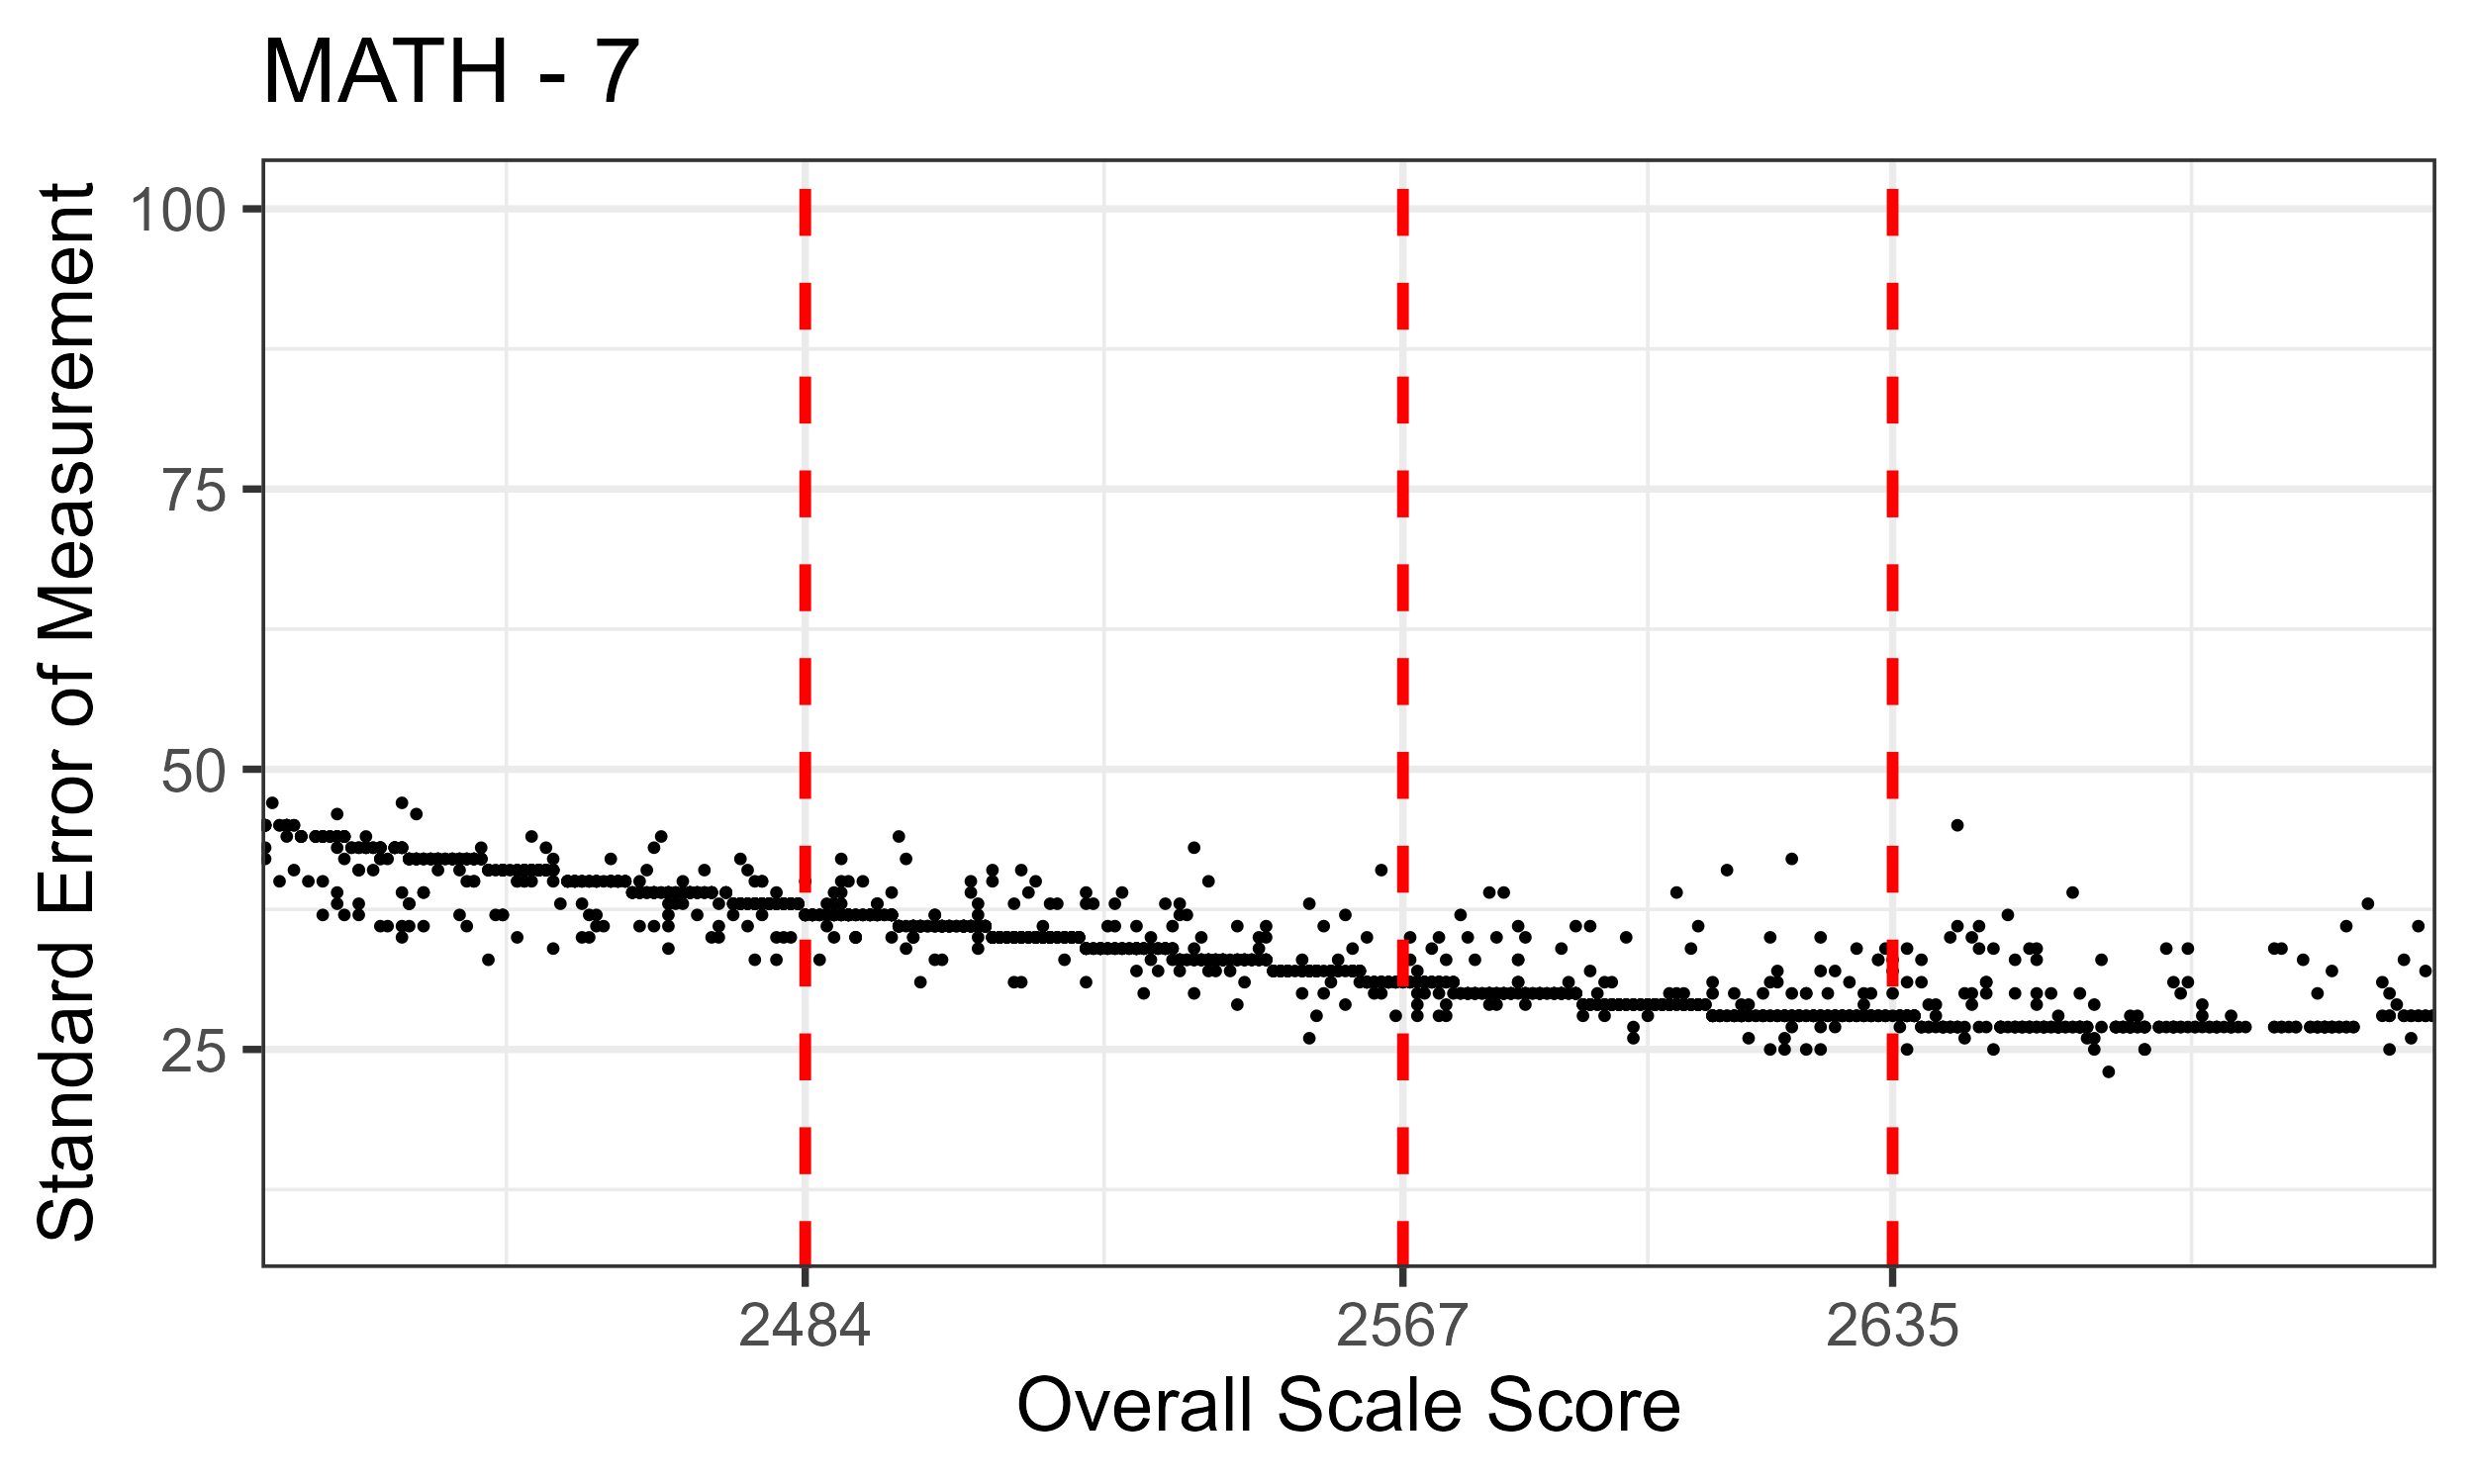
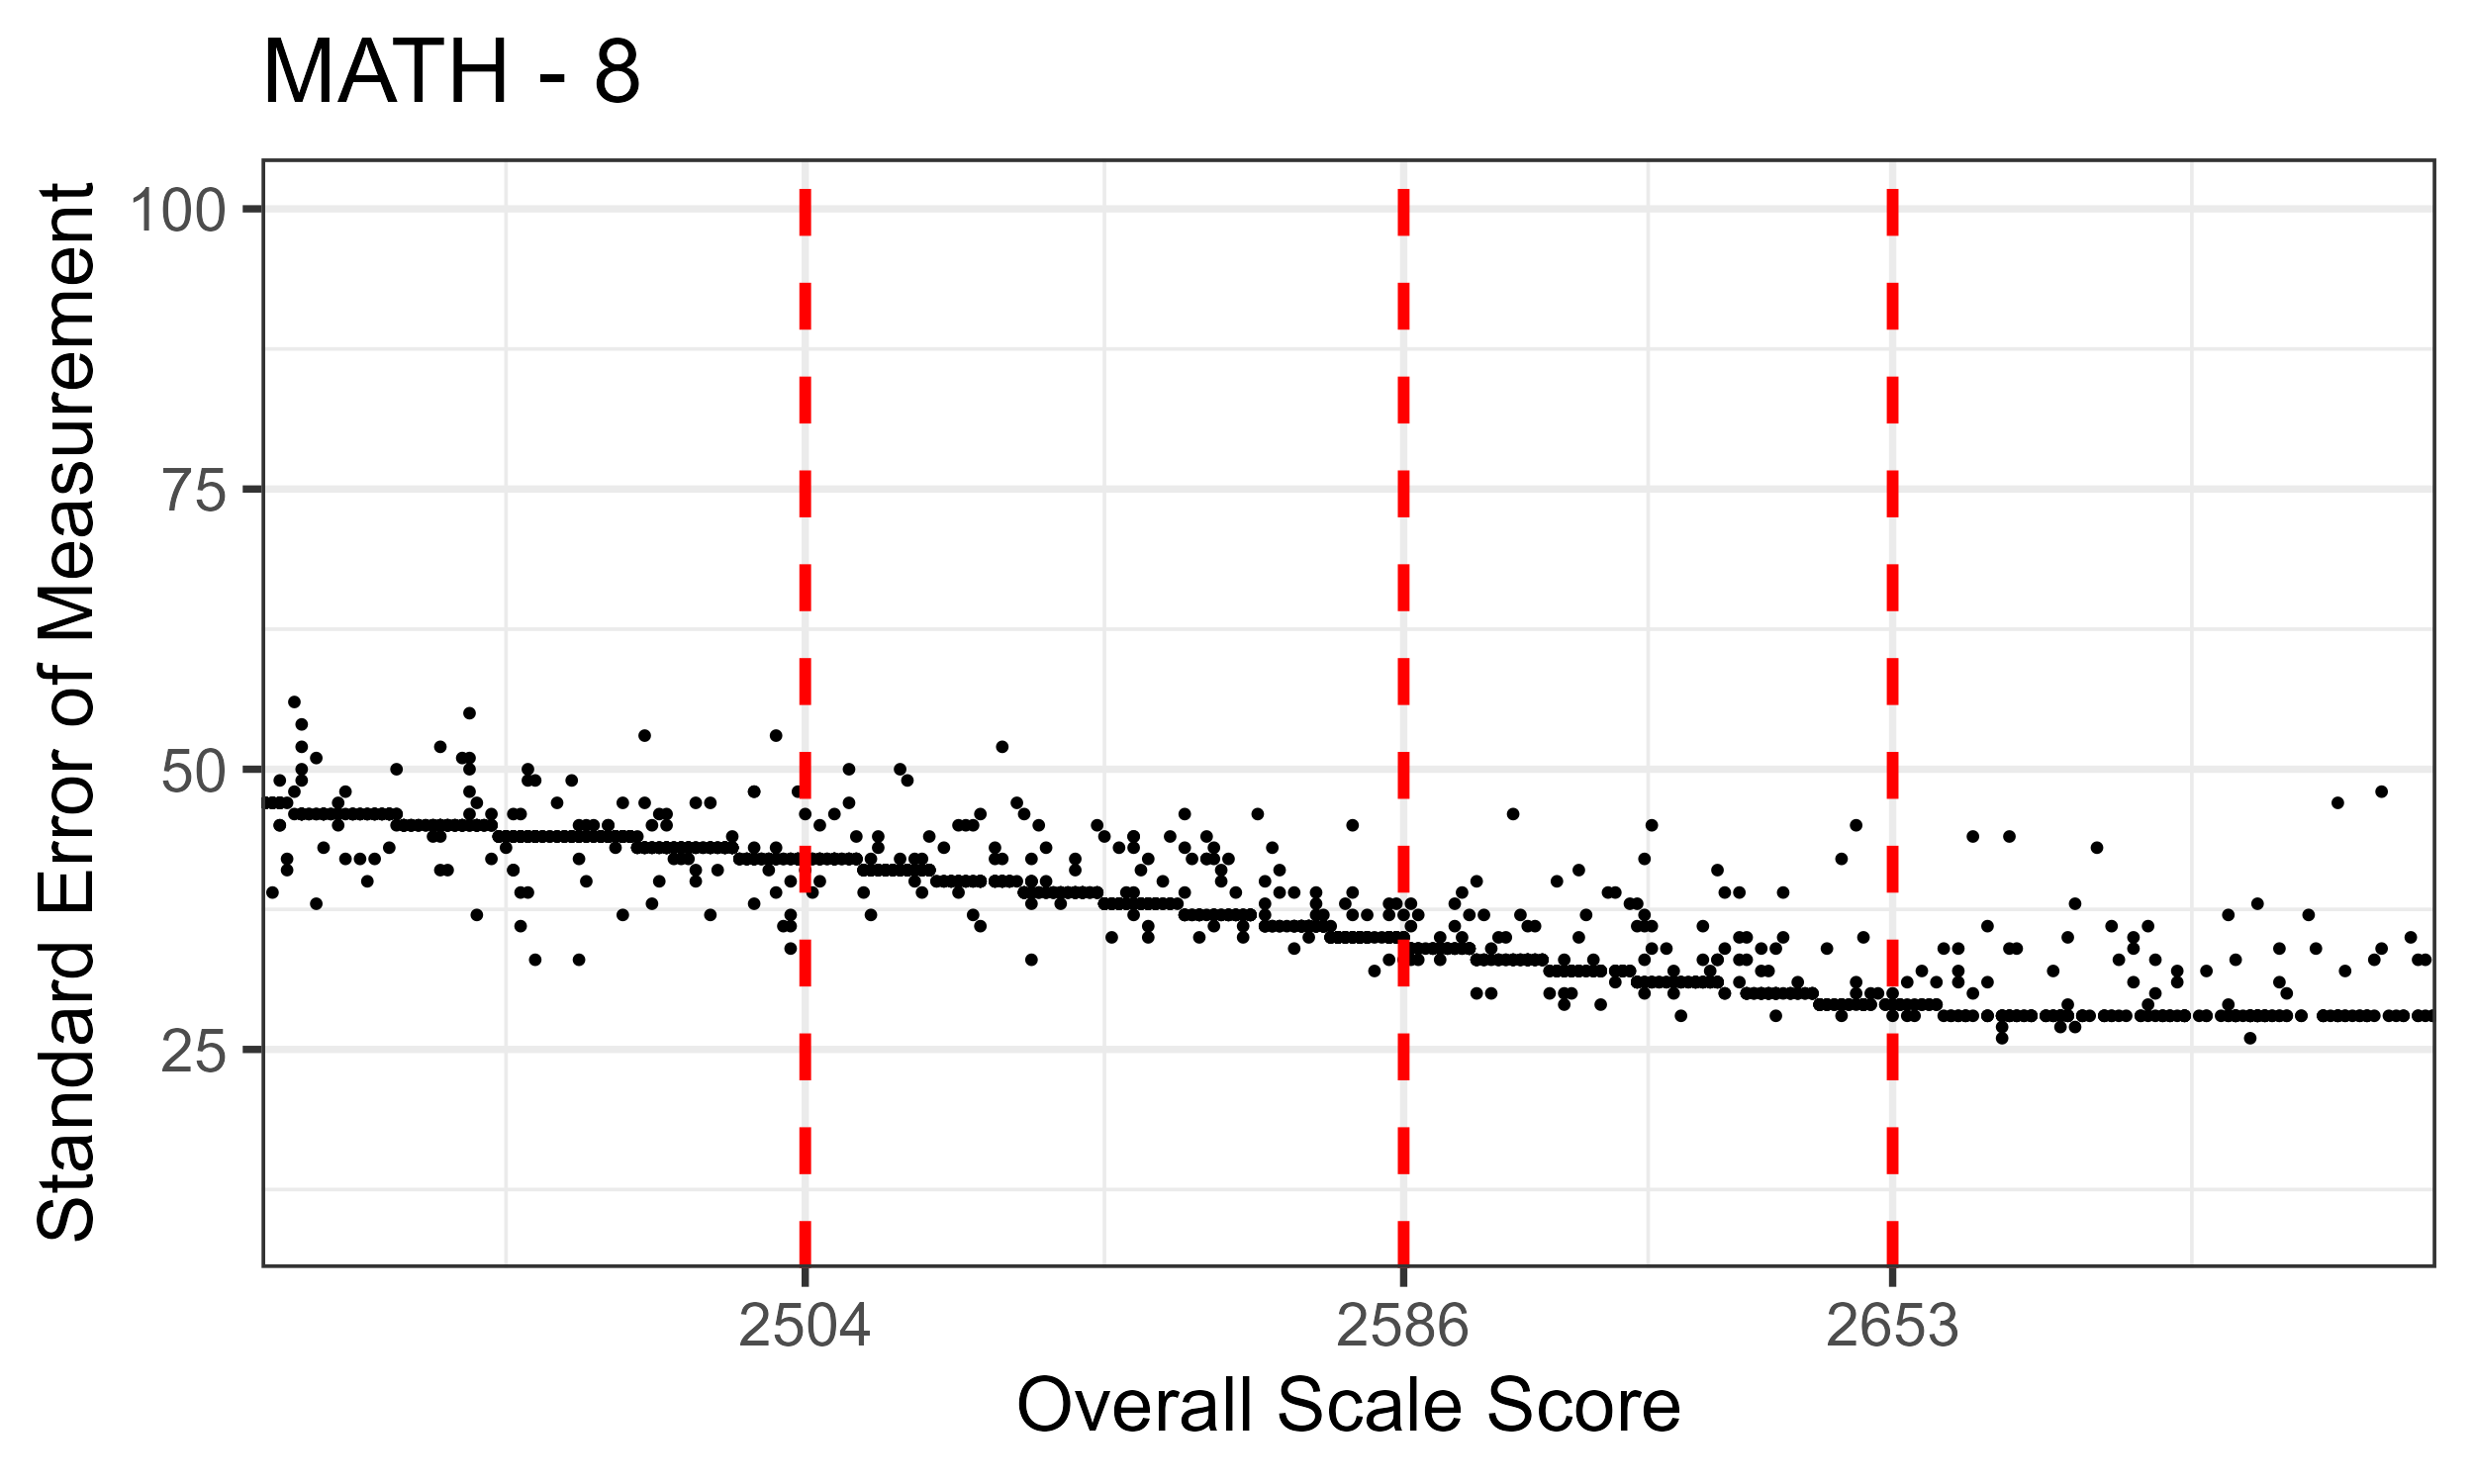
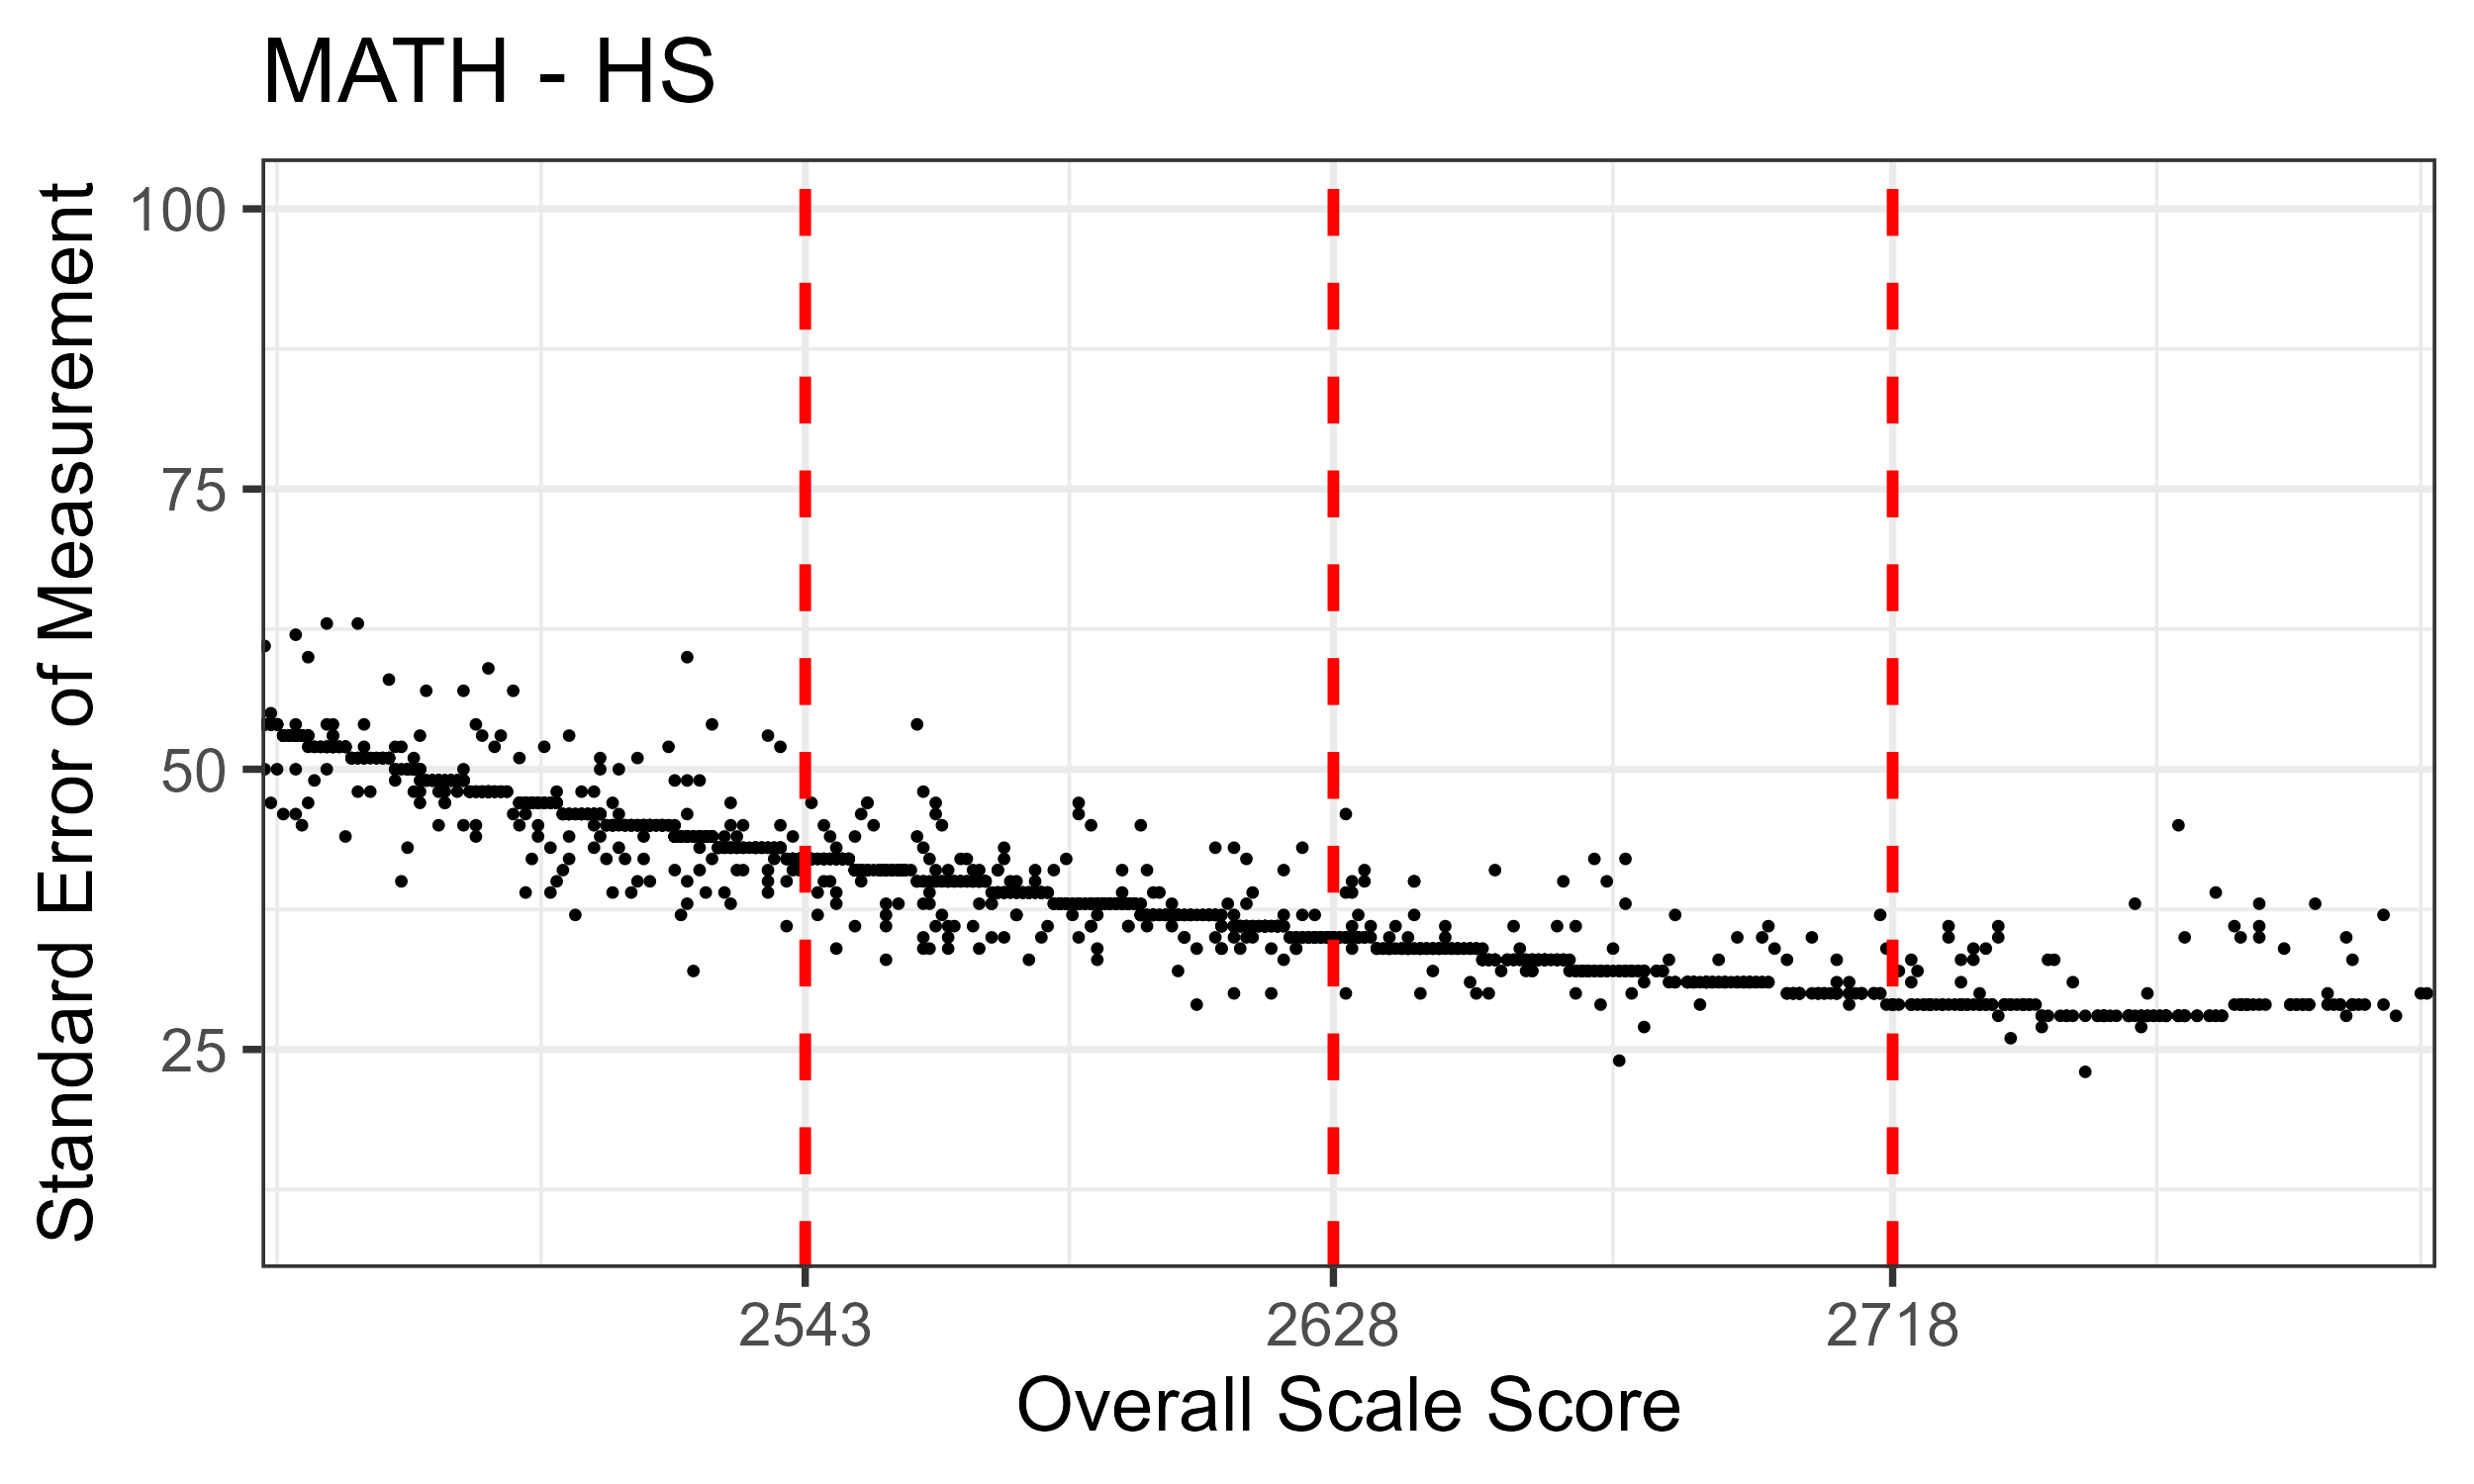
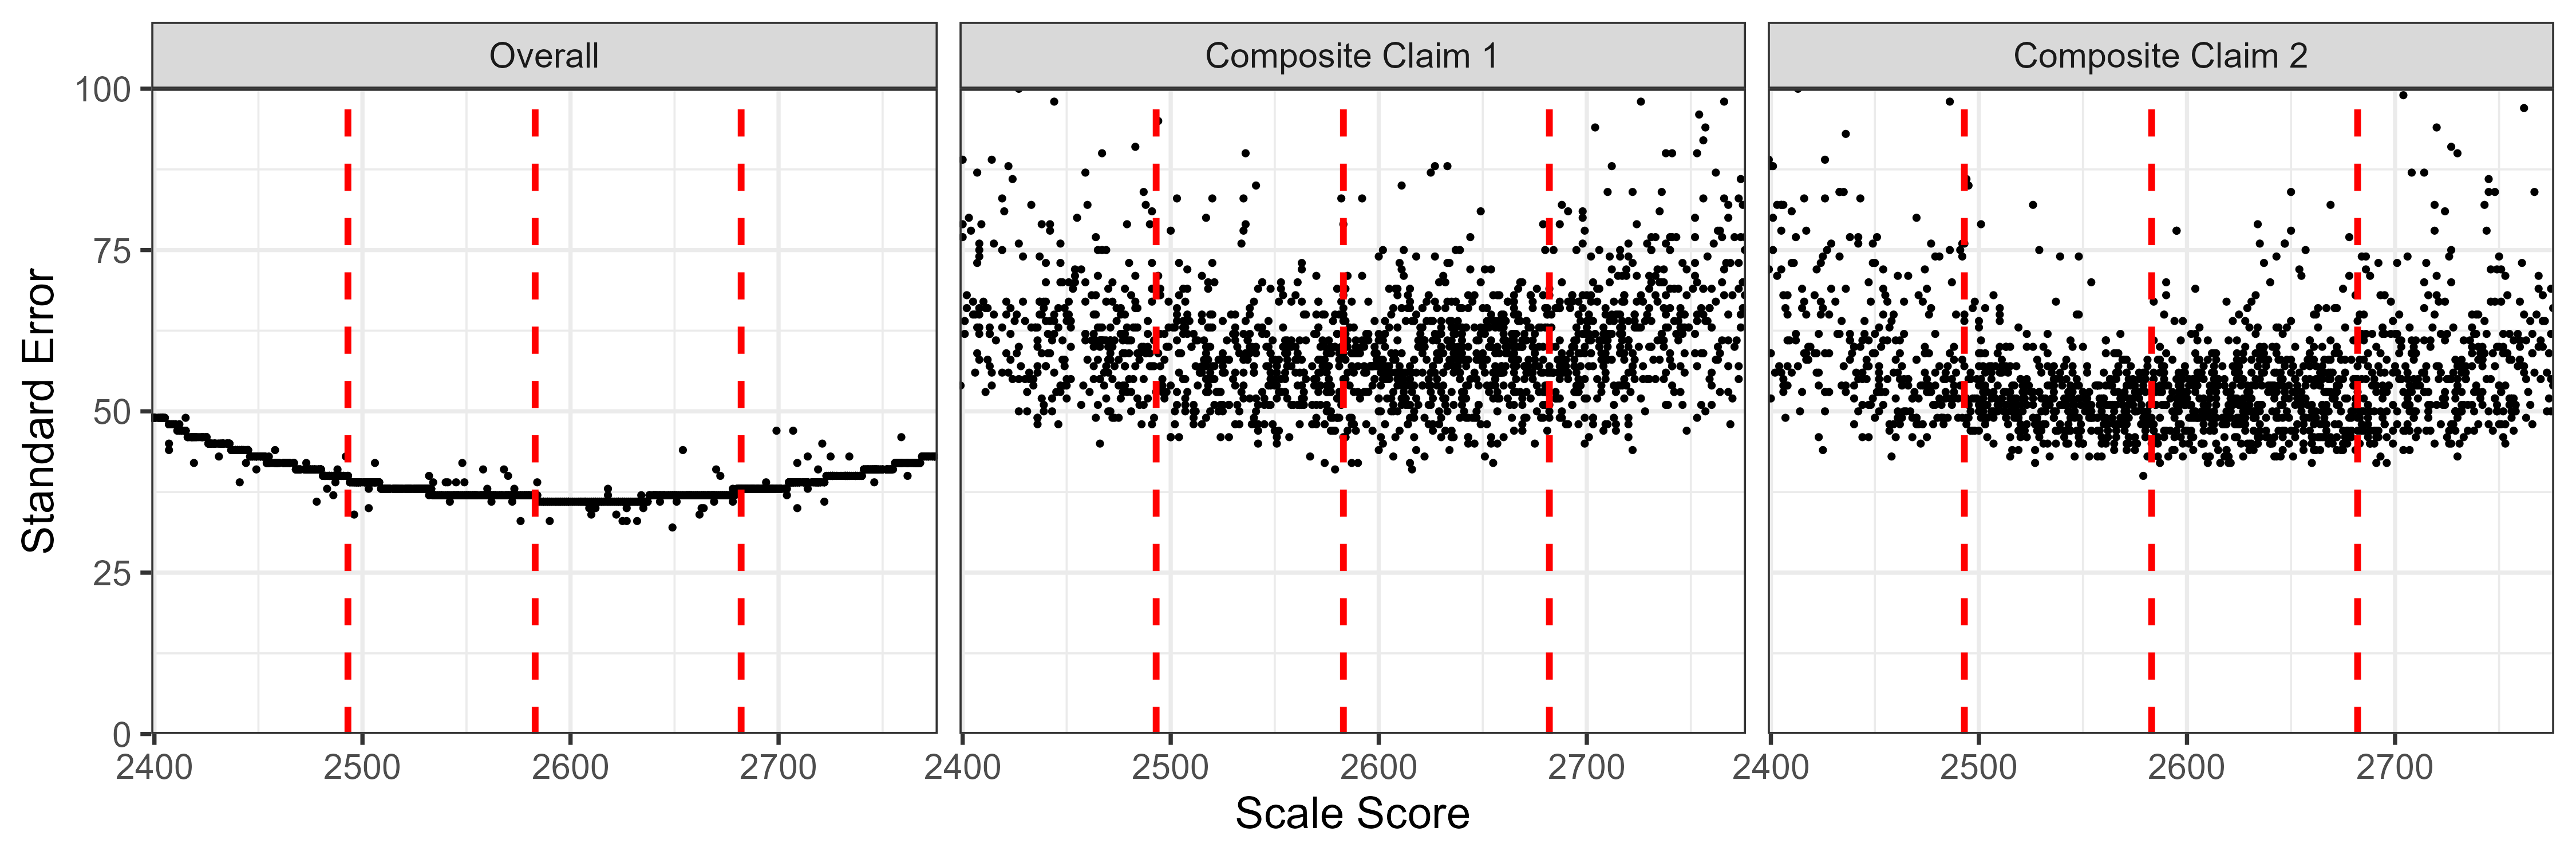
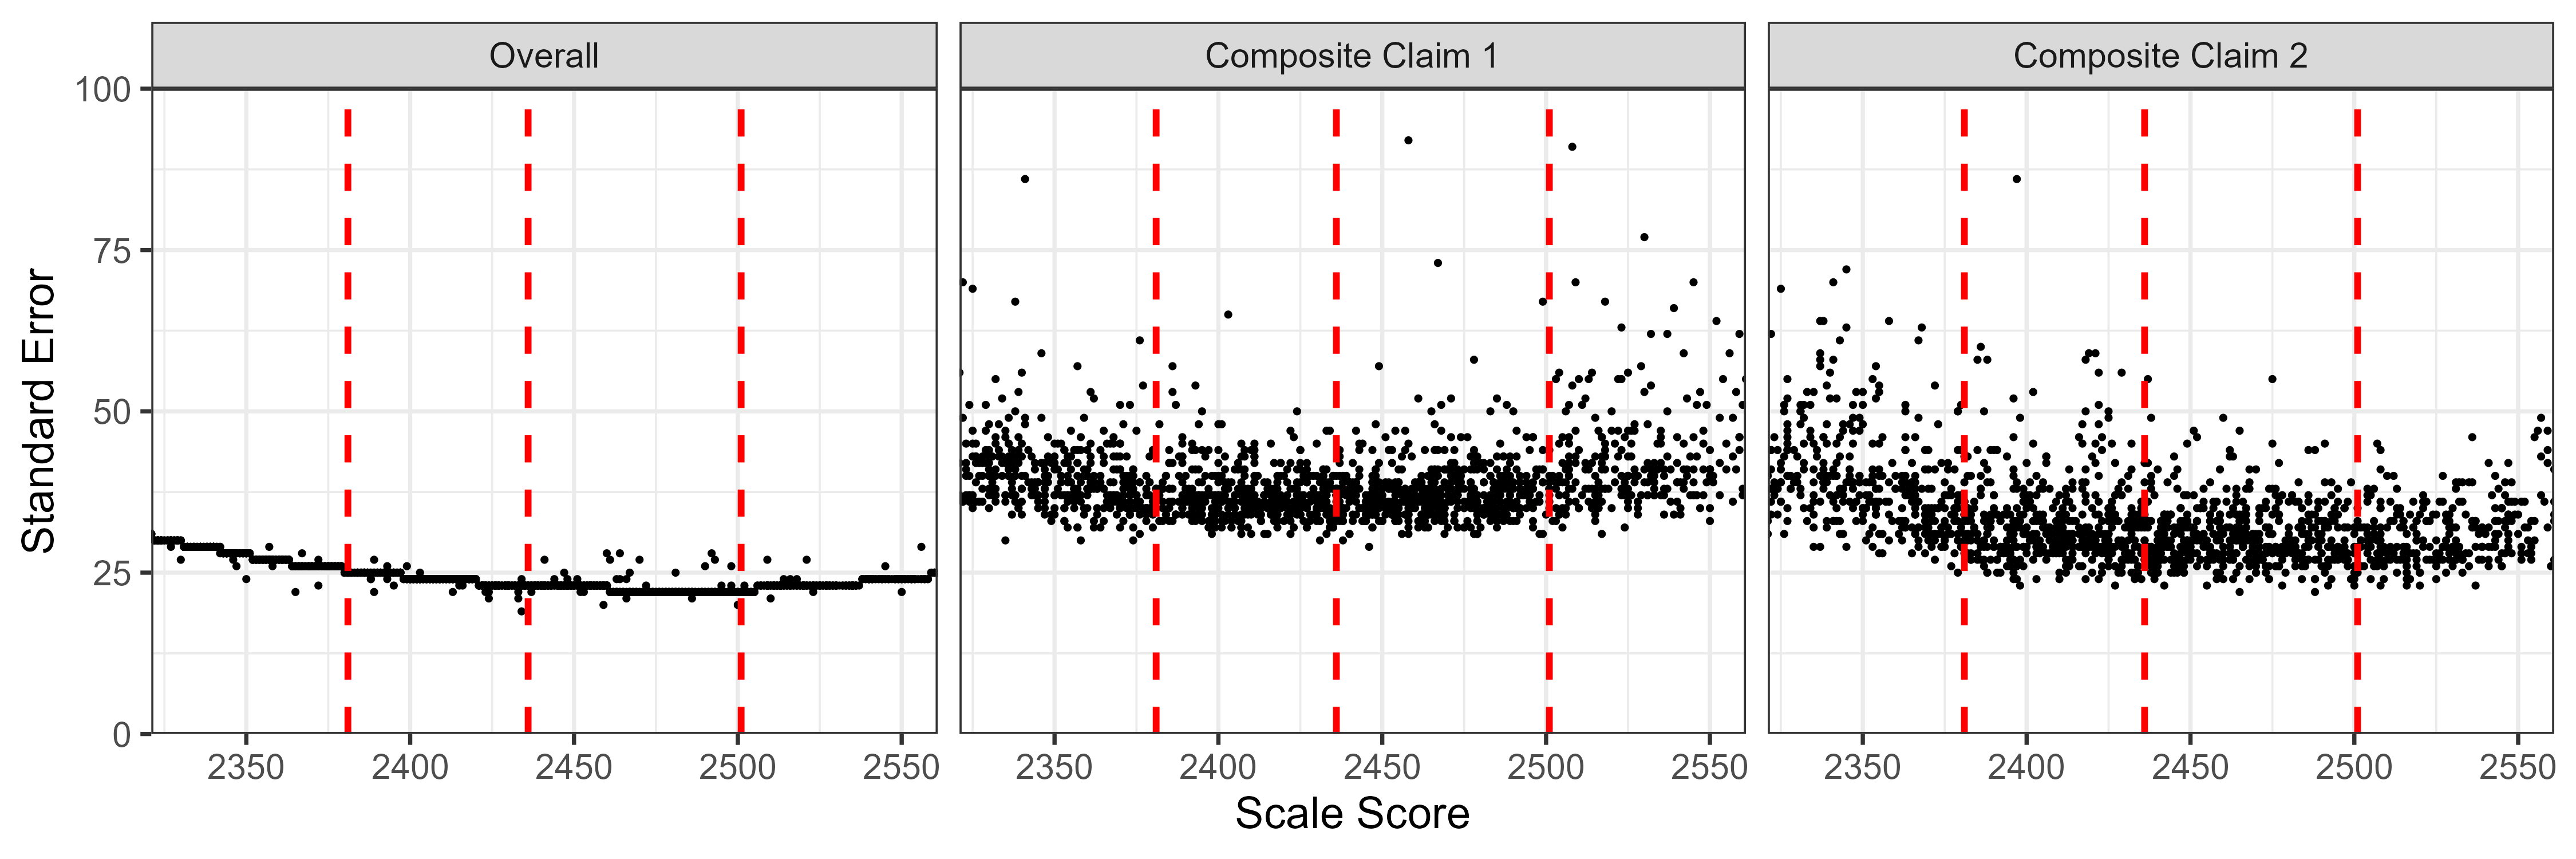
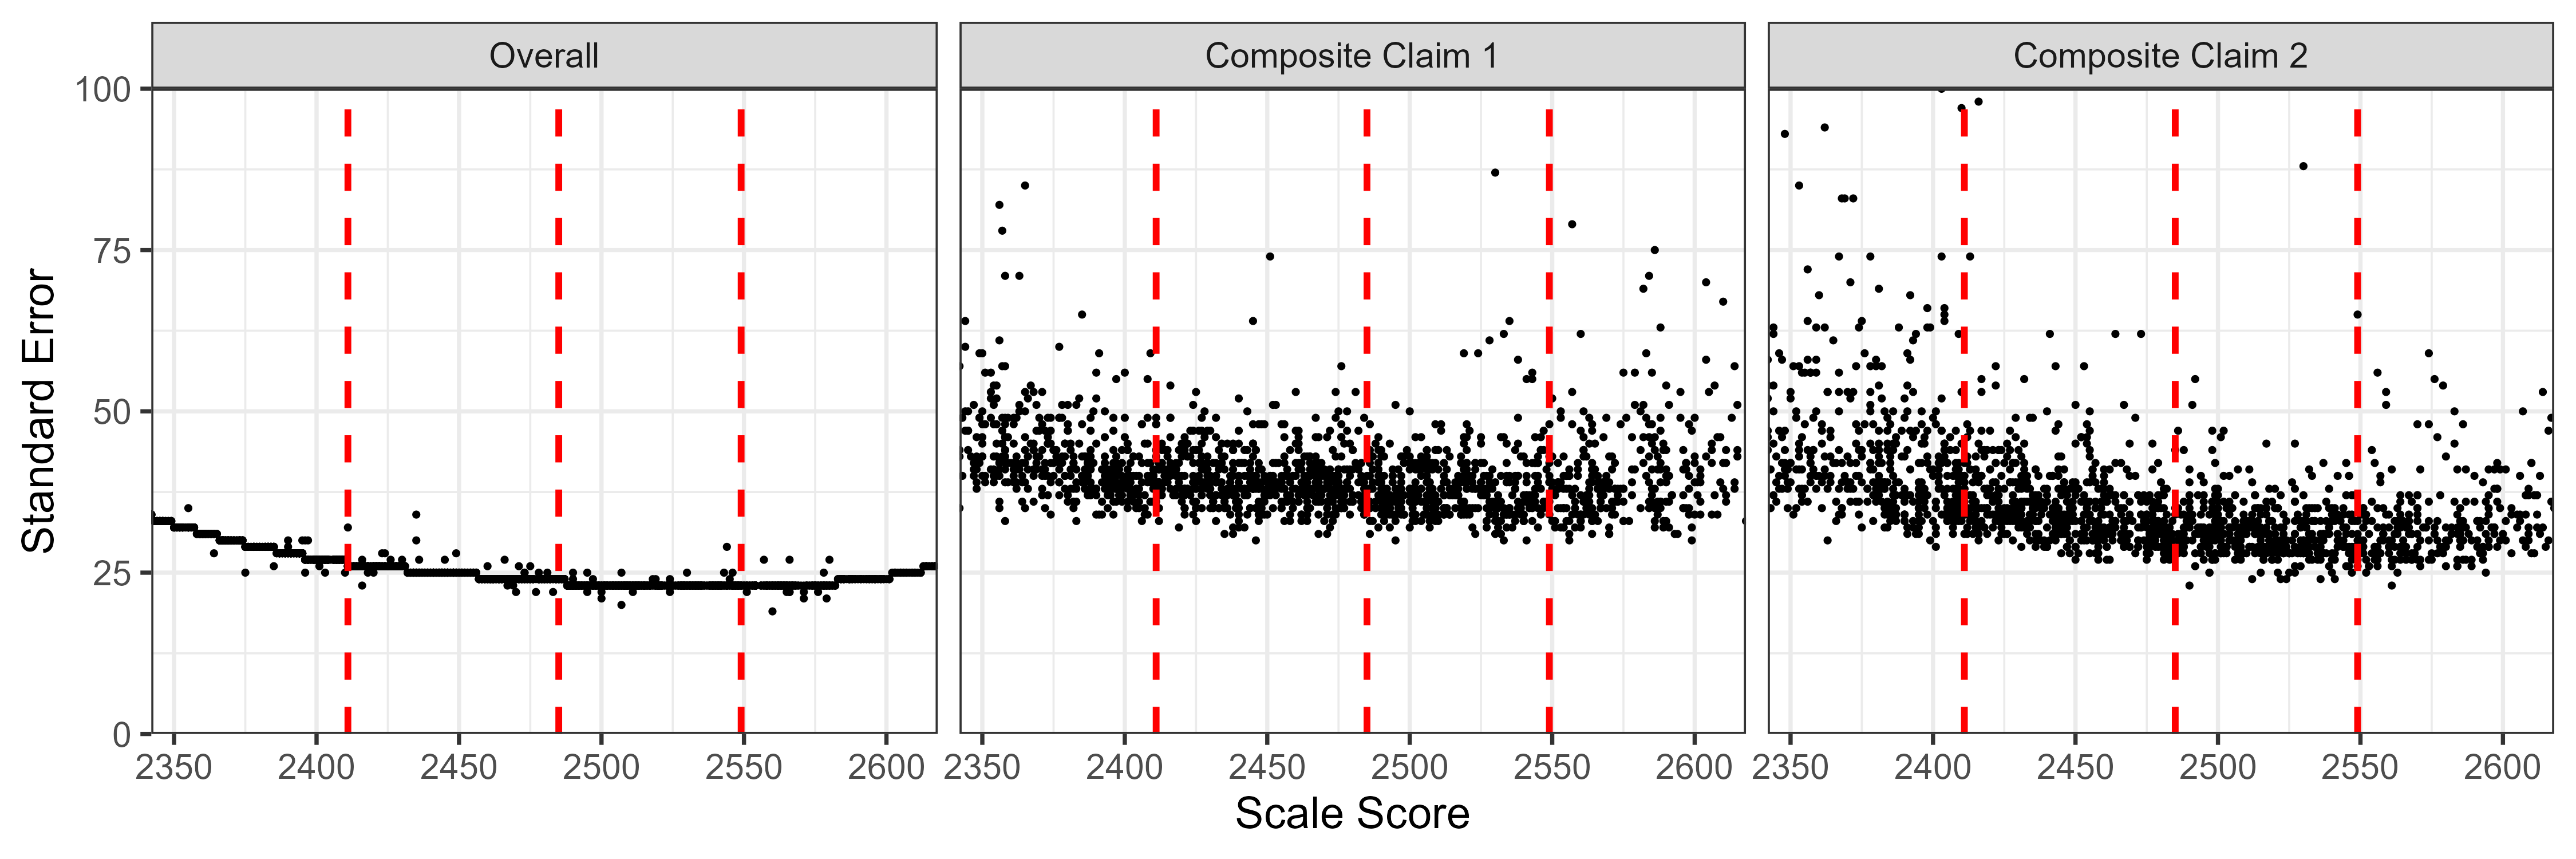
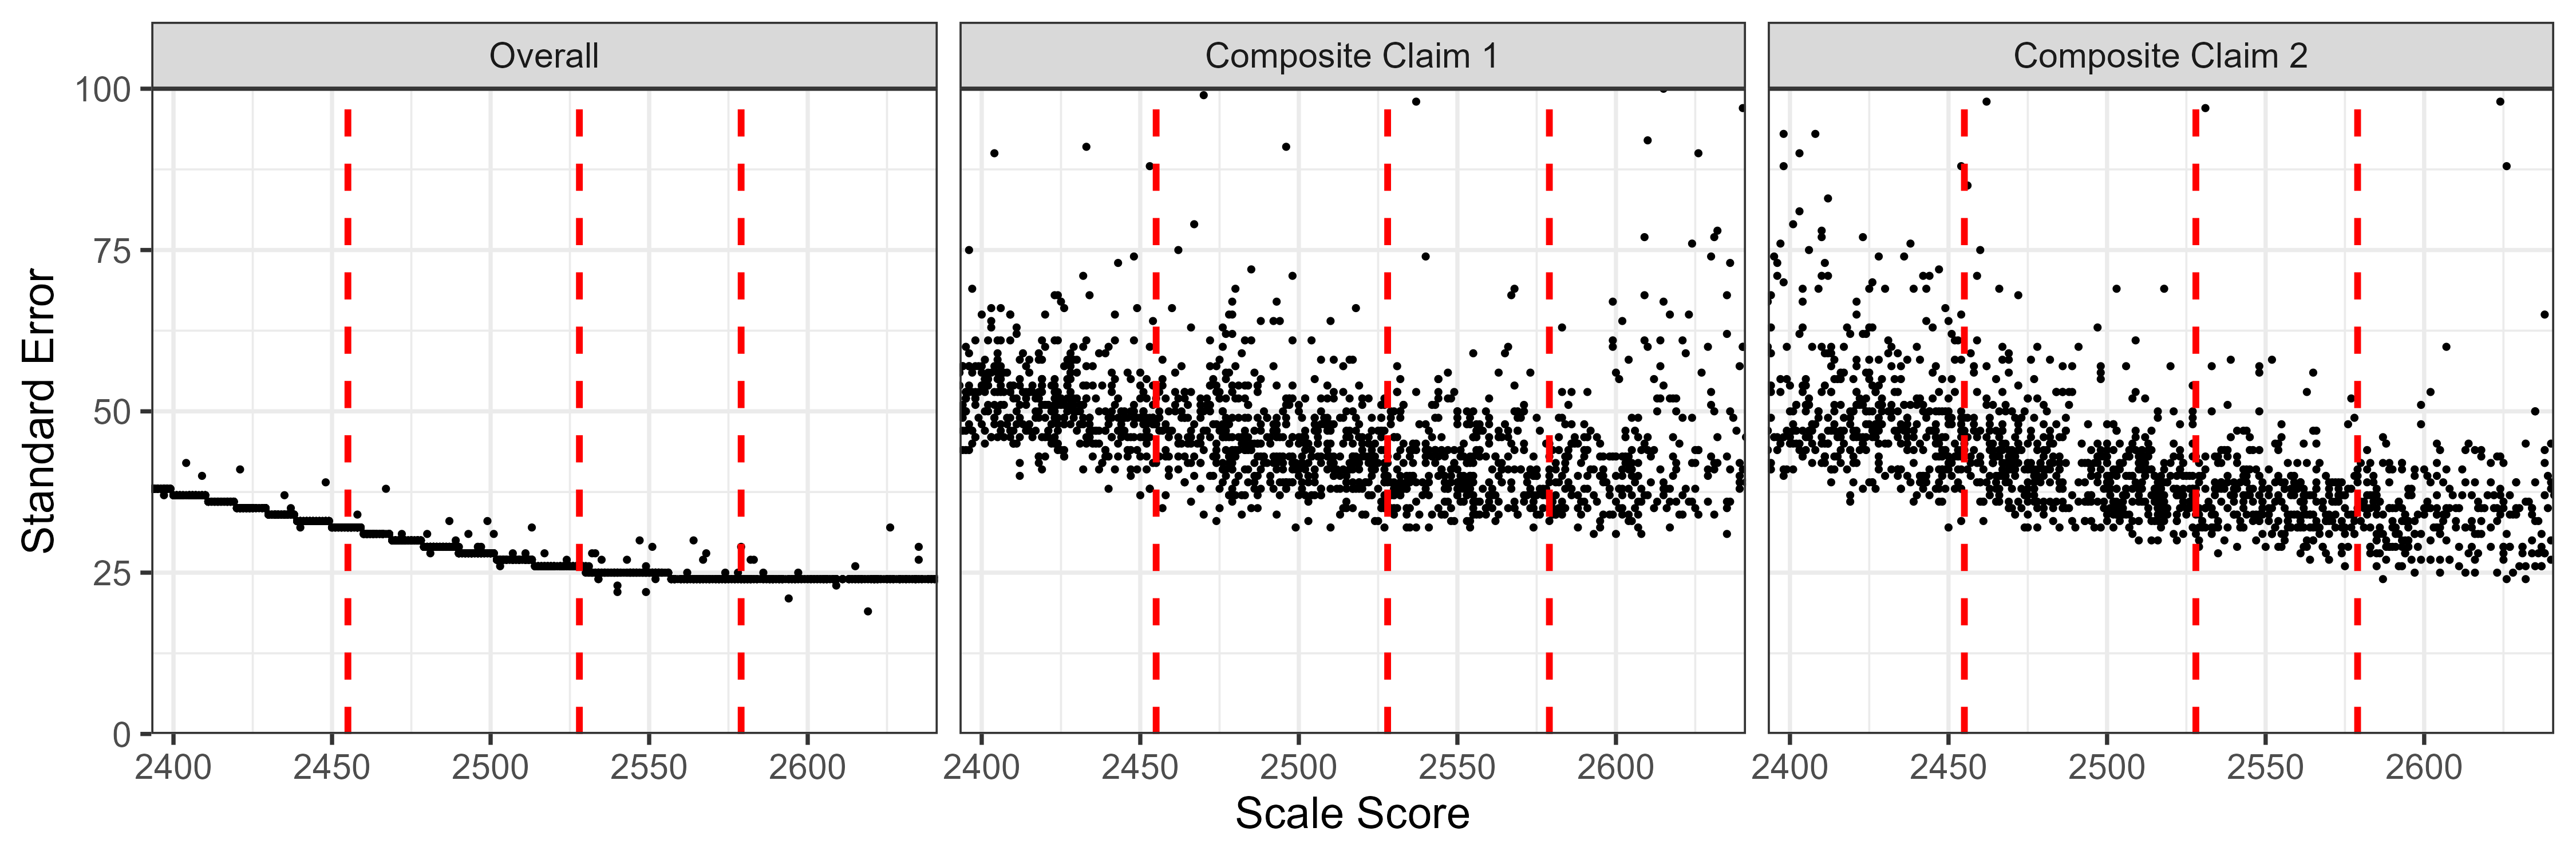
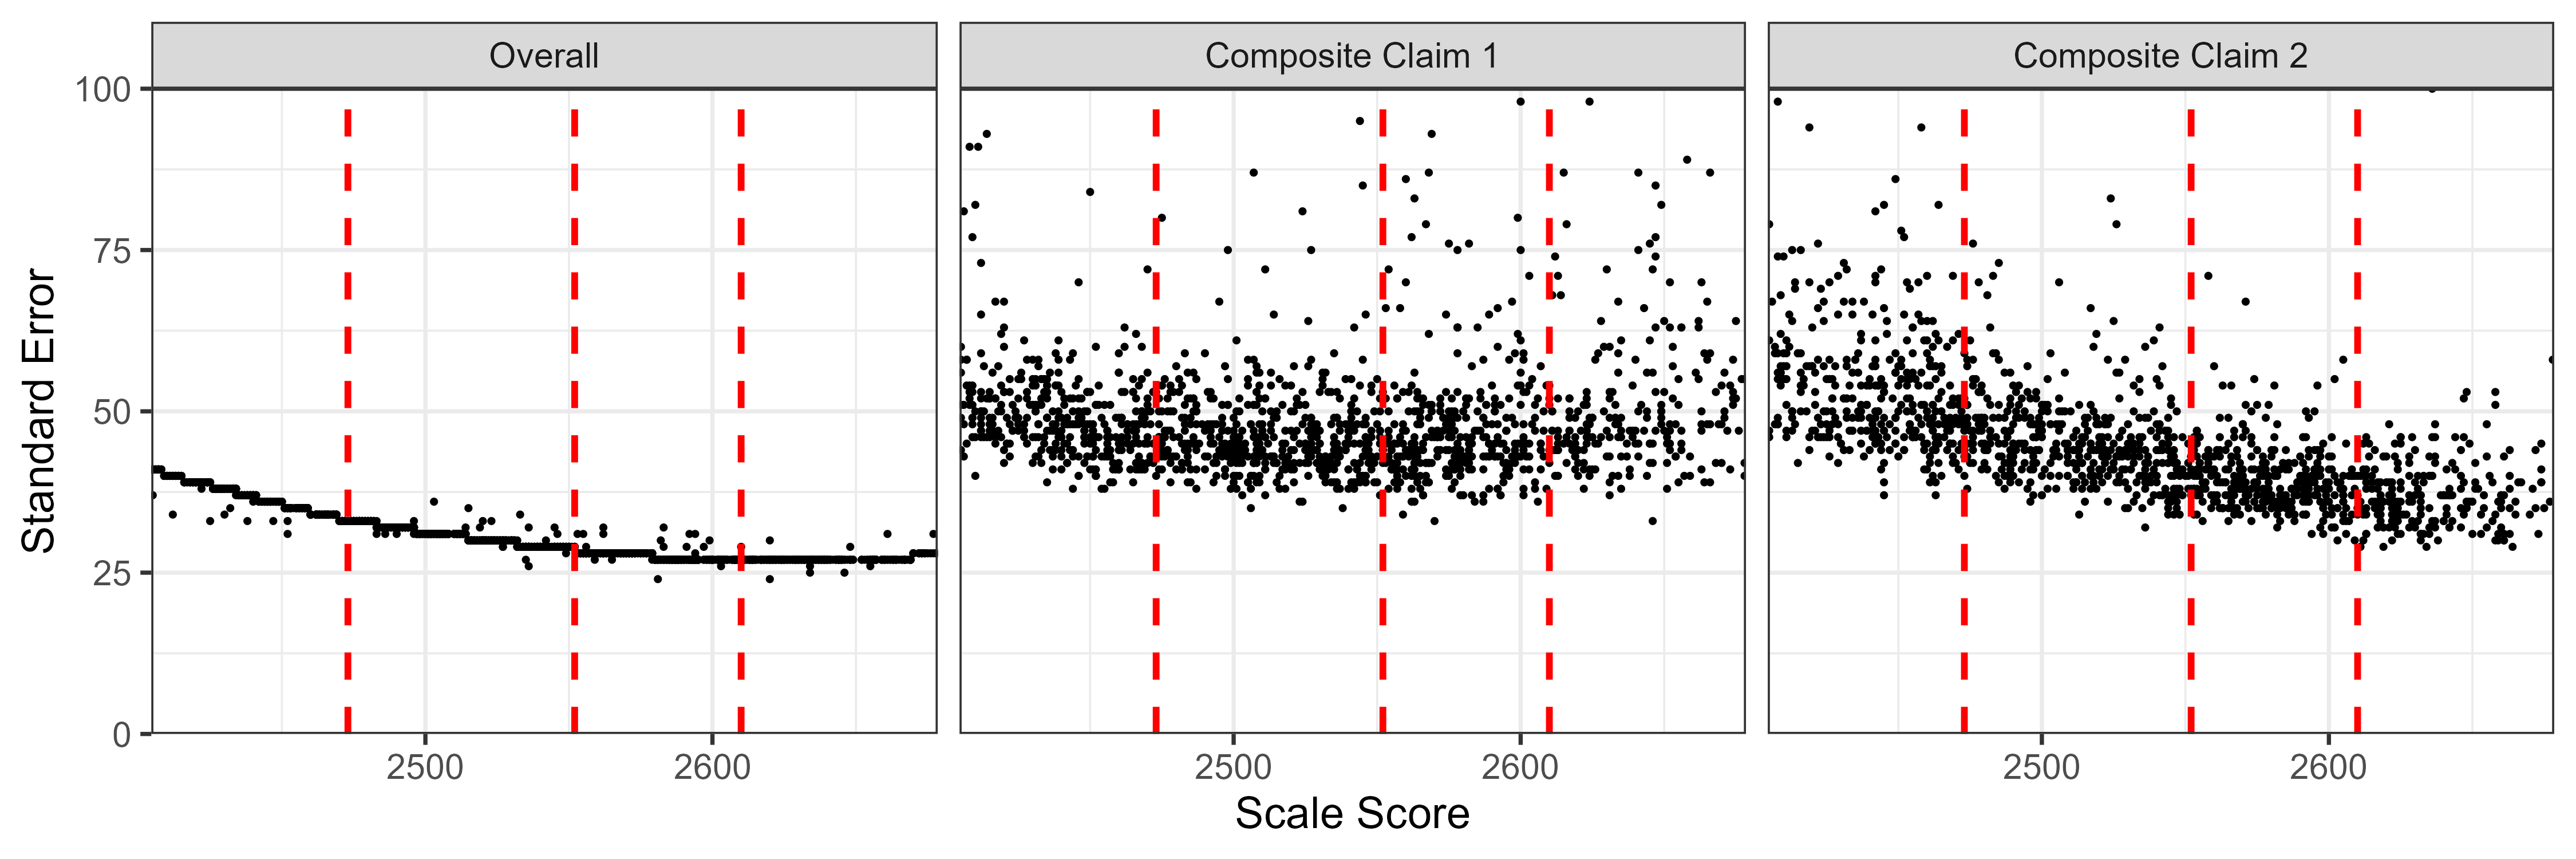
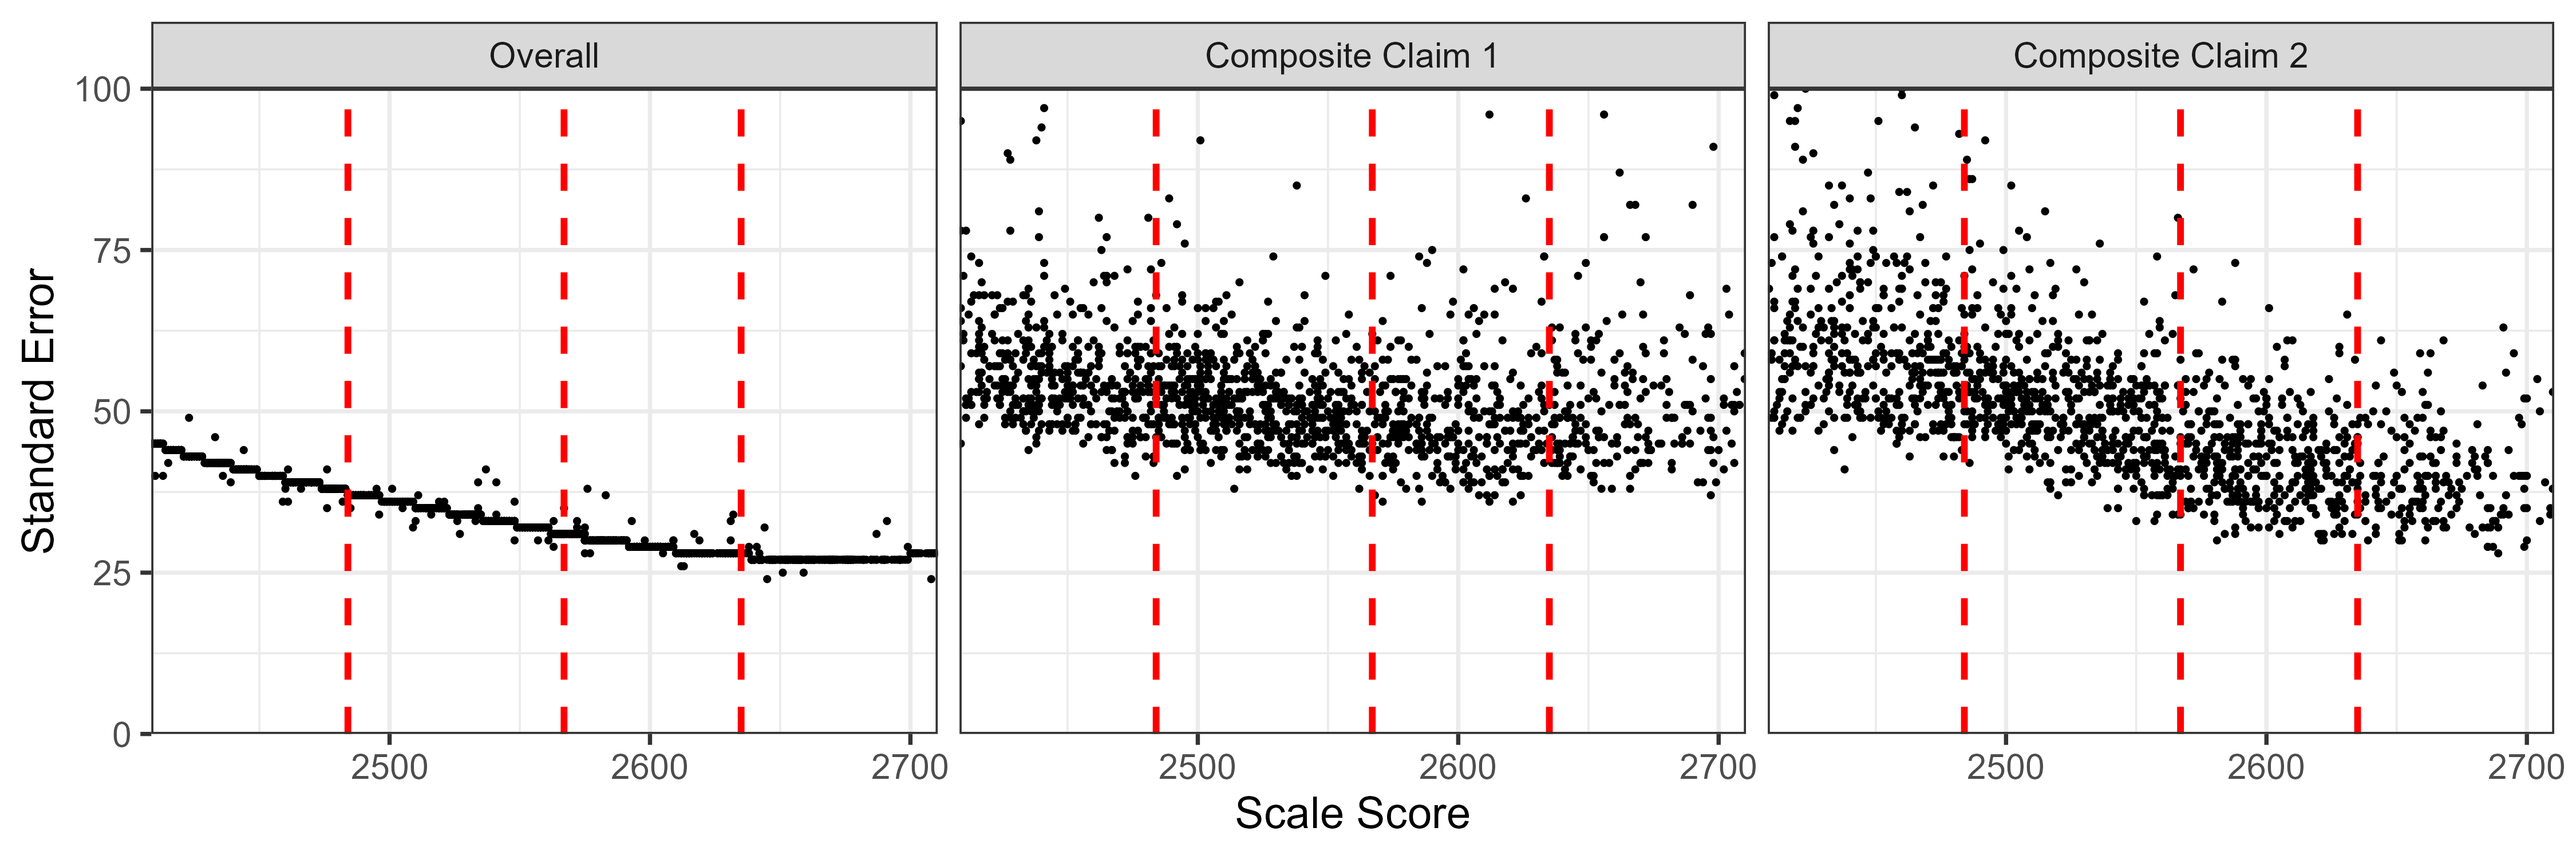
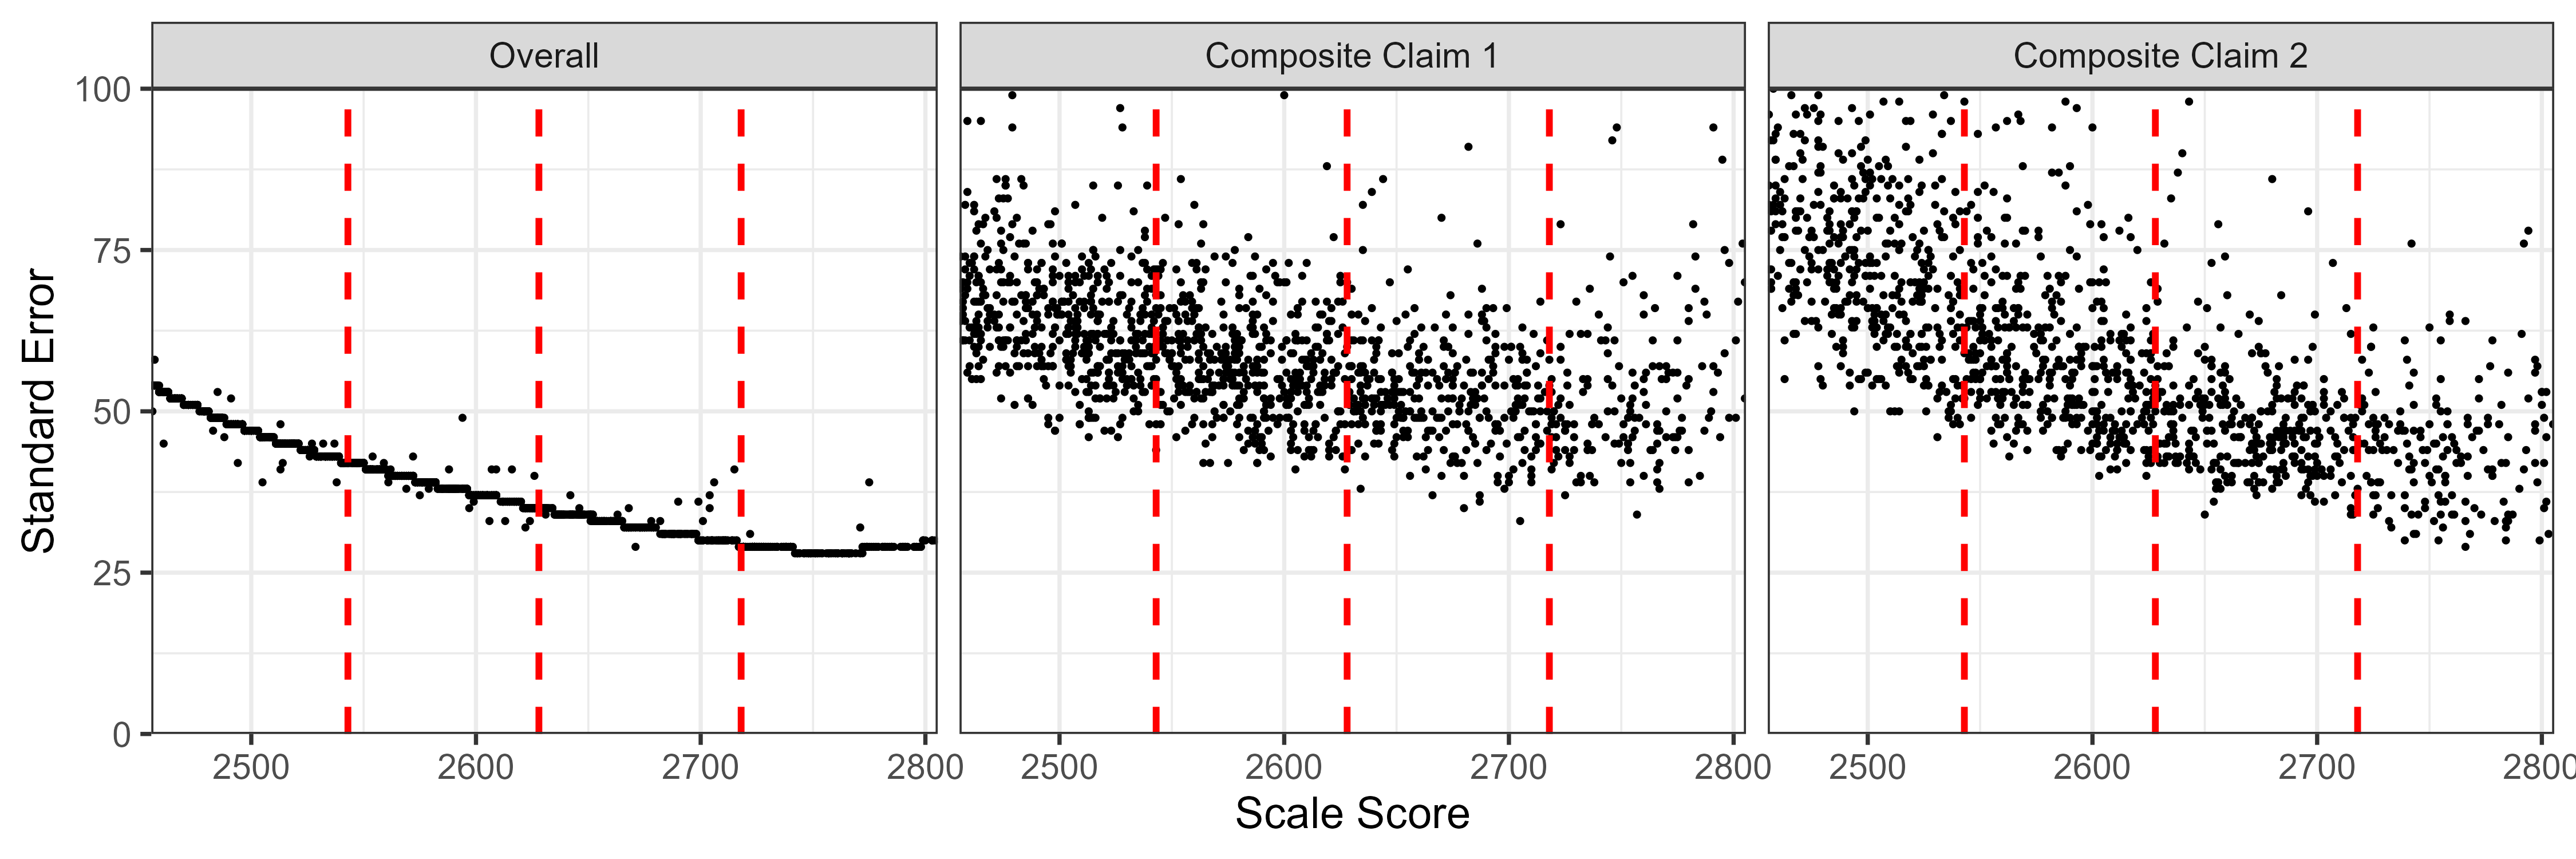
Measurement Bias
Prior to the release of the 2023-24 item pool, Cambium Assessment carried out simulation studies to ensure that the item pool, combined with the adaptive test administration algorithm, would produce satisfactory tests with regard to measurement bias and random measurement error as a function of student achievement, overall reliability, fulfillment of test blueprints, and item exposure. Simulation results for measurement bias with the adjusted blueprint are provided in this section. Measurement bias is systematic error between the true and estimated proficiency values.
Simulations for the 2023-24 administration were performed for each grade within a subject area for the standard item pool (English) and for accommodation item pools of braille and Spanish for mathematics and braille for ELA/literacy. Simulated item responses were generated based on assumed values for true student proficiency (drawn from normal distributions using parameters based on operational scores from the 2018-19 administration) and the operational item parameters. For the standard item pools, the number of simulees was 3,000 for grades 3-8 and 5,000 for grade 11. For the braille and Spanish pools, the number of simulees was 1,000 for grades 3-8 and 2,000 for grade 11. Estimated ability ( \(\hat{\theta}\) ) was calculated from the simulated tests using maximum likelihood estimation (MLE) as described in the Smarter Balanced Test Scoring Specifications. (Smarter Balanced, 2023b).
Table 8.15 and Table 8.17 show for ELA/literacy and mathematics, respectively, the bias in estimates of student proficiency based on the adjusted blueprint. Under the hypothesis of no bias, approximately 5% and 1% of the \(\theta_{i}\) will fall outside, respectively, 95% and 99% confidence intervals centered on \(\theta_{i}\). The mean bias for simulees at each decile of proficiency is provided in Table 8.16 and Table 8.18 for ELA/literacy and mathematics, respectively.
In most cases, mean bias was small and the percentage of simulated examinees with estimated achievement scores outside the confidence intervals centered on their true score was close to expected values of 5% or 1% (for the 95% and 99% confidence intervals, respectively). For grade 11 mathematics, there was mild elevation in average bias, along with mild deviation from expected confidence interval coverage. This was probably due to underestimation of theta in regions of student achievement far below the lowest cut score which was true for all grades but more extreme for mathematics grade 11. Estimation bias was negligible near all cut scores in all cases. 2023-24 data confirmed that measurement bias remains stable under the adjusted blueprint.
Table 8.15: BIAS OF THE ESTIMATED PROFICIENCIES: ELA/LITERACY
|
Pool
|
Grade
|
Mean
Bias
|
SE (Bias)
|
P value
|
MSE
|
95% CI
Miss
Rate
|
99% CI
Miss
Rate
|
|
Standard
|
3
|
0.00
|
0.01
|
0.64
|
0.23
|
4.45%
|
0.67%
|
|
4
|
-0.01
|
0.01
|
0.31
|
0.27
|
4.57%
|
0.87%
|
|
5
|
-0.01
|
0.01
|
0.33
|
0.26
|
4.91%
|
0.90%
|
|
6
|
-0.01
|
0.01
|
0.20
|
0.24
|
5.11%
|
0.67%
|
|
7
|
0.01
|
0.01
|
0.16
|
0.28
|
4.48%
|
0.94%
|
|
8
|
0.00
|
0.01
|
0.97
|
0.29
|
4.40%
|
0.60%
|
|
HS
|
0.01
|
0.01
|
0.15
|
0.34
|
4.49%
|
0.82%
|
|
Braille
|
3
|
-0.01
|
0.02
|
0.55
|
0.24
|
3.81%
|
0.60%
|
|
4
|
0.01
|
0.02
|
0.64
|
0.29
|
3.83%
|
0.91%
|
|
5
|
-0.01
|
0.02
|
0.73
|
0.24
|
4.93%
|
0.60%
|
|
6
|
0.00
|
0.02
|
0.94
|
0.27
|
5.20%
|
1.20%
|
|
7
|
-0.01
|
0.02
|
0.44
|
0.34
|
4.80%
|
1.10%
|
|
8
|
0.03
|
0.02
|
0.12
|
0.32
|
4.00%
|
0.40%
|
|
HS
|
0.02
|
0.01
|
0.08
|
0.39
|
4.18%
|
0.96%
|
Table 8.16: AVERAGE BIAS OF THE ESTIMATED PROFICIENCIES BY DECILE: ELA/LITERACY
|
Pool
|
Grade
|
1
|
2
|
3
|
4
|
5
|
6
|
7
|
8
|
9
|
10
|
|
Standard
|
3
|
0.39
|
0.13
|
0.12
|
0.06
|
0.02
|
-0.05
|
-0.07
|
-0.12
|
-0.13
|
-0.39
|
|
4
|
0.43
|
0.14
|
0.10
|
0.05
|
0.03
|
-0.06
|
-0.07
|
-0.08
|
-0.18
|
-0.47
|
|
5
|
0.37
|
0.13
|
0.12
|
0.05
|
0.02
|
-0.01
|
-0.06
|
-0.10
|
-0.17
|
-0.44
|
|
6
|
0.38
|
0.13
|
0.10
|
0.02
|
0.01
|
0.02
|
-0.07
|
-0.12
|
-0.18
|
-0.41
|
|
7
|
0.47
|
0.20
|
0.17
|
0.08
|
0.03
|
-0.03
|
-0.07
|
-0.13
|
-0.17
|
-0.41
|
|
8
|
0.53
|
0.14
|
0.12
|
0.05
|
0.03
|
-0.01
|
-0.08
|
-0.13
|
-0.23
|
-0.41
|
|
HS
|
0.51
|
0.18
|
0.09
|
0.02
|
0.01
|
0.02
|
-0.06
|
-0.07
|
-0.17
|
-0.41
|
|
Braille
|
3
|
0.44
|
0.12
|
0.08
|
0.06
|
0.01
|
-0.04
|
-0.13
|
-0.11
|
-0.20
|
-0.31
|
|
4
|
0.49
|
0.19
|
0.12
|
-0.04
|
0.03
|
-0.04
|
-0.01
|
-0.13
|
-0.14
|
-0.40
|
|
5
|
0.40
|
0.12
|
0.11
|
0.03
|
0.07
|
-0.02
|
-0.10
|
-0.04
|
-0.23
|
-0.39
|
|
6
|
0.45
|
0.13
|
0.10
|
0.06
|
0.03
|
-0.09
|
-0.10
|
-0.02
|
-0.21
|
-0.33
|
|
7
|
0.55
|
0.15
|
0.17
|
0.12
|
-0.03
|
0.00
|
-0.08
|
-0.20
|
-0.27
|
-0.56
|
|
8
|
0.63
|
0.22
|
0.13
|
0.07
|
0.04
|
-0.05
|
-0.05
|
-0.14
|
-0.16
|
-0.40
|
|
HS
|
0.68
|
0.16
|
0.14
|
0.00
|
0.01
|
-0.02
|
-0.03
|
-0.08
|
-0.19
|
-0.42
|
Table 8.17: BIAS OF THE ESTIMATED PROFICIENCIES: MATHEMATICS
|
Pool
|
Grade
|
Mean
Bias
|
SE (Bias)
|
P value
|
MSE
|
95% CI
Miss
Rate
|
99% CI
Miss
Rate
|
|
Standard
|
3
|
0.01
|
0.01
|
0.3
|
0.16
|
4.37%
|
0.77%
|
|
4
|
0.01
|
0.01
|
0.14
|
0.16
|
4.71%
|
1.14%
|
|
5
|
0.02
|
0.01
|
0.01
|
0.25
|
5.11%
|
0.87%
|
|
6
|
0.03
|
0.01
|
0.01
|
0.26
|
4.52%
|
1.04%
|
|
7
|
0.03
|
0.01
|
< 0.005
|
0.31
|
4.40%
|
0.71%
|
|
8
|
0.01
|
0.01
|
0.22
|
0.40
|
5.07%
|
1.04%
|
|
HS
|
0.05
|
0.01
|
< 0.005
|
0.47
|
3.72%
|
0.60%
|
|
Braille
|
3
|
0.03
|
0.01
|
0.03
|
0.20
|
5.04%
|
1.11%
|
|
4
|
0.00
|
0.01
|
0.72
|
0.17
|
4.54%
|
0.91%
|
|
5
|
0.00
|
0.02
|
0.88
|
0.24
|
5.03%
|
0.70%
|
|
6
|
0.03
|
0.02
|
0.12
|
0.32
|
4.66%
|
1.11%
|
|
7
|
0.03
|
0.02
|
0.19
|
0.38
|
5.59%
|
0.71%
|
|
8
|
0.04
|
0.02
|
0.1
|
0.44
|
3.65%
|
0.91%
|
|
HS
|
0.12
|
0.02
|
< 0.005
|
0.78
|
4.71%
|
0.71%
|
|
Spanish
|
3
|
-0.02
|
0.01
|
0.14
|
0.16
|
4.62%
|
1.41%
|
|
4
|
-0.01
|
0.01
|
0.7
|
0.18
|
6.43%
|
1.21%
|
|
5
|
0.02
|
0.02
|
0.29
|
0.24
|
3.83%
|
0.81%
|
|
6
|
0.02
|
0.02
|
0.28
|
0.24
|
3.32%
|
0.60%
|
|
7
|
-0.03
|
0.02
|
0.05
|
0.30
|
4.38%
|
1.22%
|
|
8
|
0.00
|
0.02
|
0.84
|
0.42
|
4.31%
|
1.40%
|
|
HS
|
0.07
|
0.02
|
< 0.005
|
0.52
|
4.72%
|
1.01%
|
Table 8.18: AVERAGE BIAS OF THE ESTIMATED PROFICIENCIES BY DECILE: MATHEMATICS
|
Pool
|
Grade
|
1
|
2
|
3
|
4
|
5
|
6
|
7
|
8
|
9
|
10
|
|
Standard
|
3
|
0.32
|
0.11
|
0.06
|
0.02
|
0.00
|
-0.01
|
-0.02
|
-0.09
|
-0.05
|
-0.26
|
|
4
|
0.32
|
0.13
|
0.05
|
0.03
|
0.00
|
-0.03
|
-0.03
|
-0.05
|
-0.09
|
-0.24
|
|
5
|
0.47
|
0.16
|
0.13
|
0.08
|
-0.02
|
-0.04
|
-0.07
|
-0.09
|
-0.09
|
-0.29
|
|
6
|
0.42
|
0.19
|
0.13
|
0.05
|
0.02
|
-0.04
|
-0.06
|
-0.05
|
-0.10
|
-0.29
|
|
7
|
0.53
|
0.17
|
0.07
|
0.00
|
0.01
|
-0.01
|
-0.08
|
-0.10
|
-0.09
|
-0.22
|
|
8
|
0.54
|
0.21
|
0.06
|
0.07
|
-0.04
|
-0.01
|
-0.09
|
-0.13
|
-0.16
|
-0.31
|
|
HS
|
0.90
|
0.23
|
0.11
|
0.04
|
0.00
|
-0.06
|
-0.10
|
-0.13
|
-0.18
|
-0.26
|
|
Braille
|
3
|
0.42
|
0.17
|
0.06
|
0.01
|
-0.02
|
0.03
|
0.03
|
-0.09
|
-0.06
|
-0.23
|
|
4
|
0.27
|
0.13
|
0.02
|
0.01
|
0.02
|
0.01
|
-0.04
|
-0.07
|
-0.01
|
-0.31
|
|
5
|
0.36
|
0.09
|
0.12
|
0.05
|
0.05
|
-0.06
|
-0.12
|
-0.08
|
-0.09
|
-0.30
|
|
6
|
0.54
|
0.14
|
0.08
|
0.03
|
0.05
|
-0.07
|
-0.10
|
-0.03
|
-0.08
|
-0.28
|
|
7
|
0.71
|
0.14
|
0.09
|
0.00
|
-0.04
|
-0.02
|
-0.14
|
-0.09
|
-0.16
|
-0.24
|
|
8
|
0.63
|
0.36
|
0.12
|
0.10
|
-0.09
|
0.06
|
-0.10
|
-0.20
|
-0.22
|
-0.31
|
|
HS
|
1.40
|
0.49
|
0.14
|
-0.01
|
-0.05
|
-0.07
|
-0.05
|
-0.13
|
-0.26
|
-0.31
|
|
Spanish
|
3
|
0.26
|
0.07
|
0.04
|
-0.04
|
-0.02
|
-0.01
|
-0.03
|
-0.06
|
-0.05
|
-0.34
|
|
4
|
0.29
|
0.15
|
0.07
|
0.02
|
0.03
|
-0.06
|
-0.05
|
-0.12
|
-0.11
|
-0.27
|
|
5
|
0.50
|
0.15
|
0.03
|
0.06
|
-0.10
|
-0.05
|
-0.04
|
-0.03
|
-0.08
|
-0.29
|
|
6
|
0.43
|
0.15
|
0.11
|
0.04
|
0.01
|
-0.07
|
-0.02
|
-0.05
|
-0.13
|
-0.29
|
|
7
|
0.33
|
0.07
|
0.05
|
-0.01
|
-0.09
|
0.00
|
-0.12
|
-0.10
|
-0.07
|
-0.41
|
|
8
|
0.53
|
0.27
|
0.10
|
0.10
|
-0.02
|
-0.09
|
-0.13
|
-0.13
|
-0.24
|
-0.36
|
|
HS
|
0.86
|
0.32
|
0.23
|
0.09
|
-0.03
|
-0.02
|
-0.14
|
-0.17
|
-0.24
|
-0.24
|
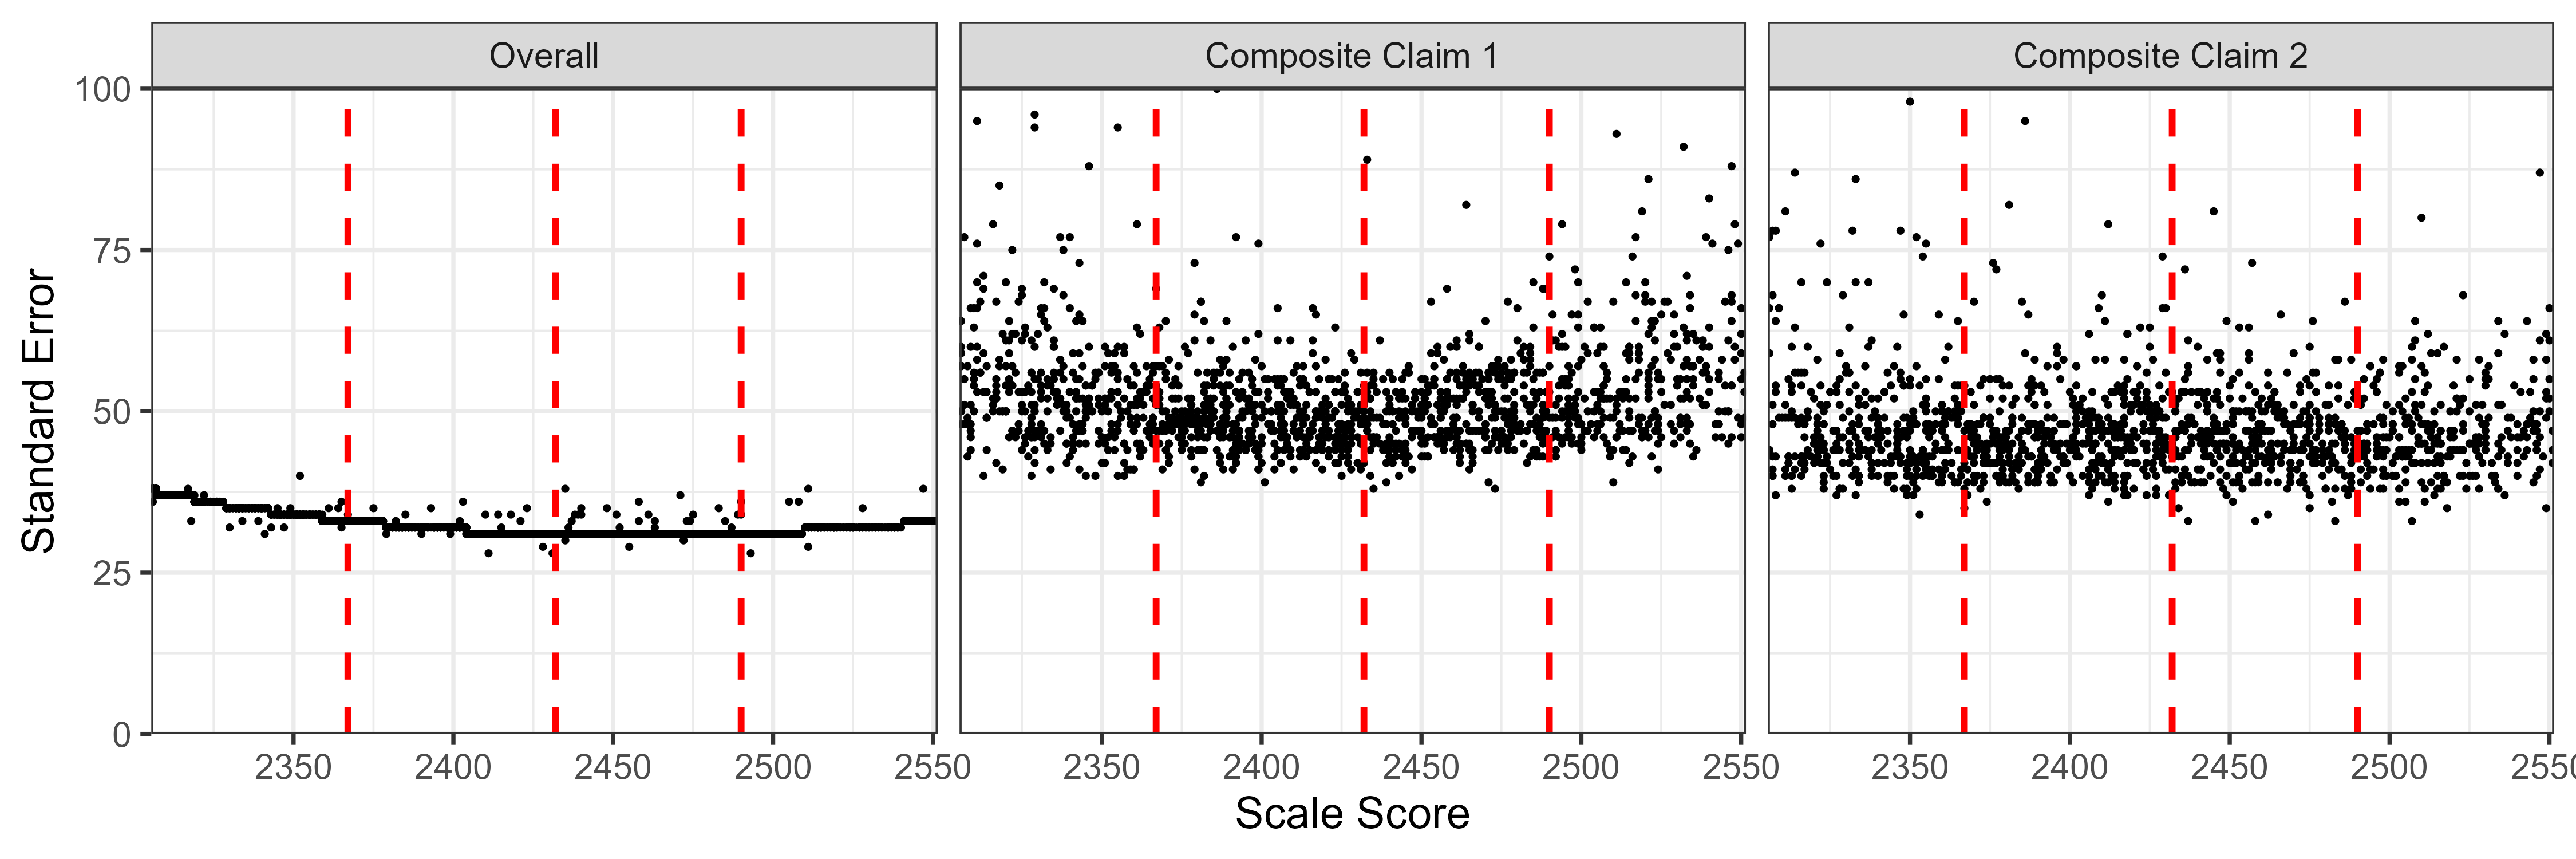
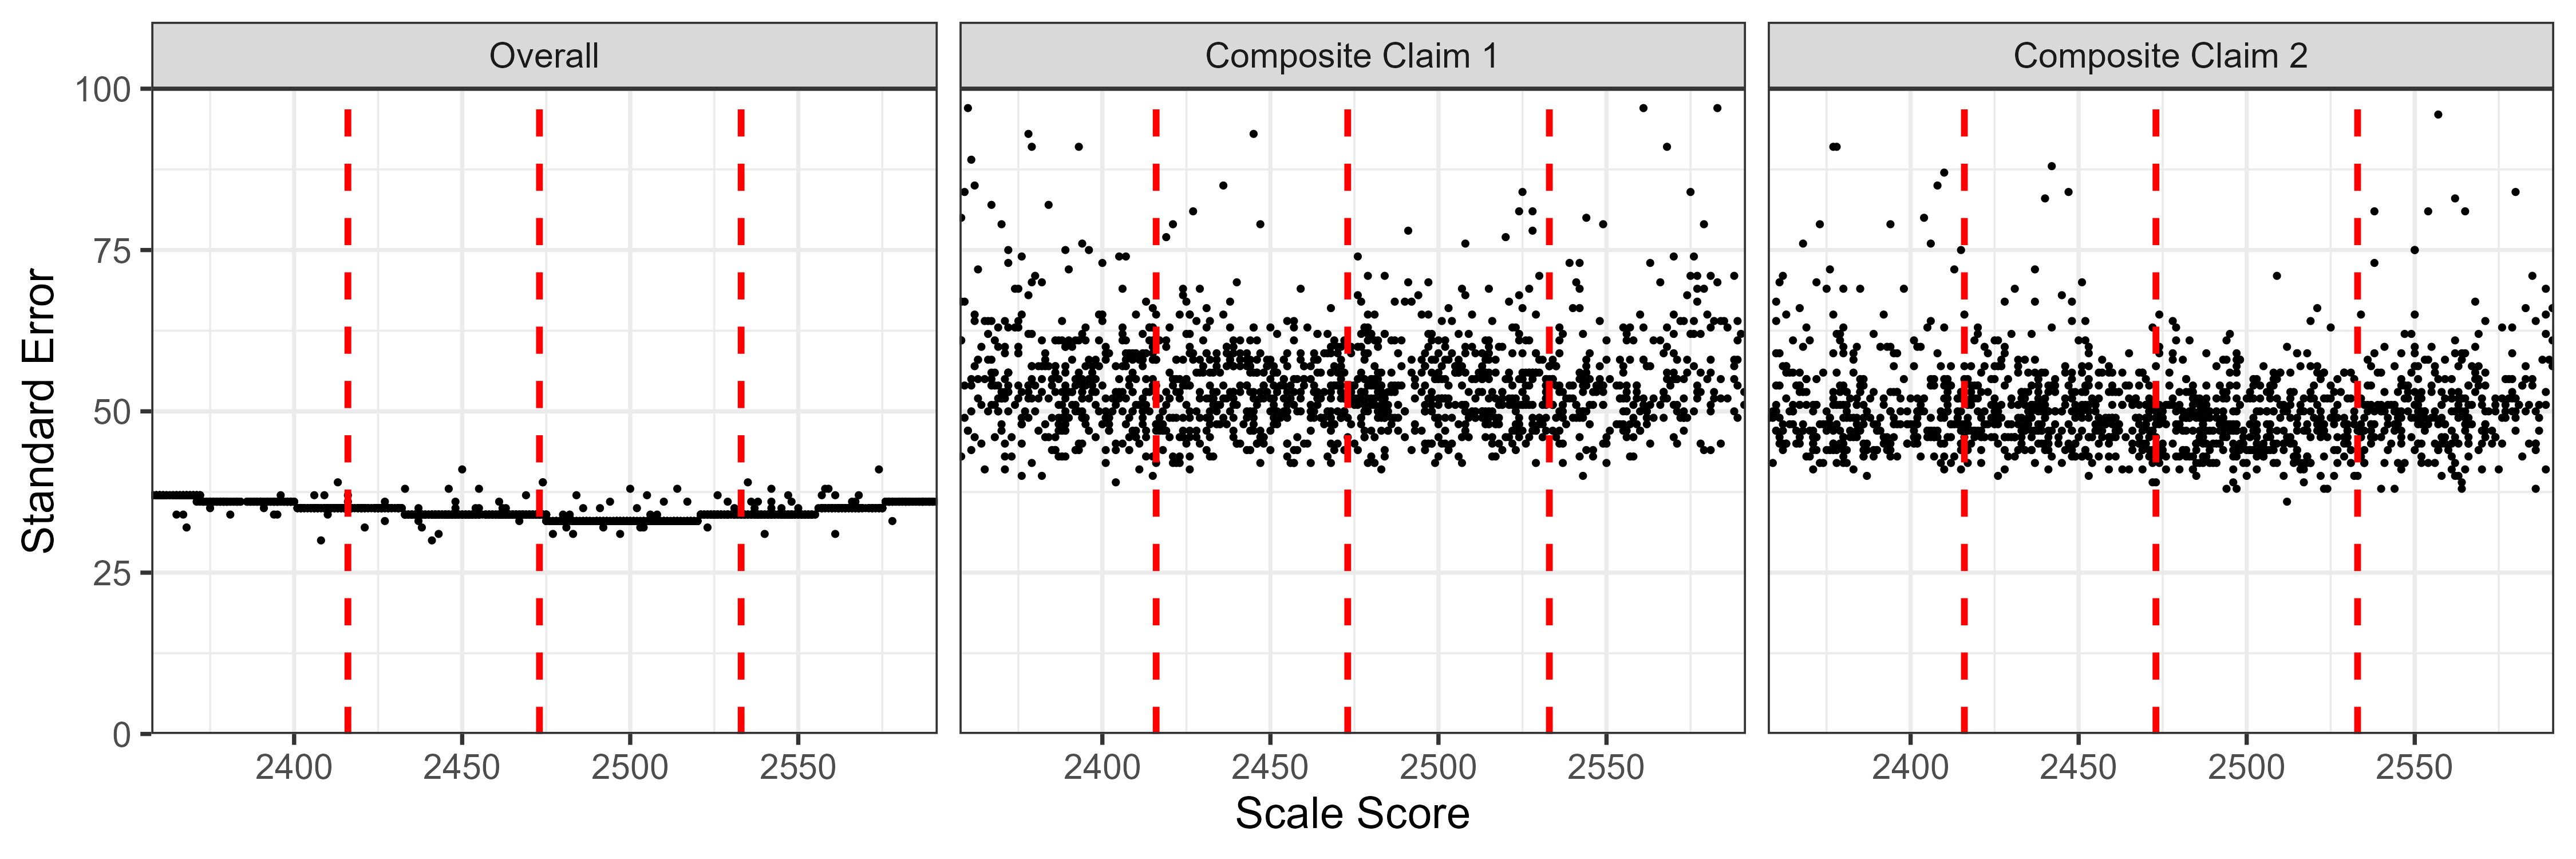
Reliability
Reliability estimates in this section are based on real data and the adjusted blueprint. Due to different schools’ responses to post-pandemic test administration in 2023-24, results presented here for demographic groups should not be considered as representative of the whole population. Table 8.19 and Table 8.20 show the reliability (Rho) of the test for all students and for students based on demographic group in ELA/literacy and mathematics.
Table 8.19: MARGINAL RELIABILITY OF TOTAL SUMMATIVE SCORES: ELA/LITERACY
|
Grade
|
Group
|
N
|
Var
|
MSE
|
Rho
|
|
GRADE 3
|
Total
|
561,435
|
10322
|
1318
|
0.872
|
|
Female
|
257,137
|
10180
|
1300
|
0.872
|
|
Male
|
285,915
|
10391
|
1348
|
0.870
|
|
Native American or Alaska Native
|
5,725
|
8939
|
1312
|
0.853
|
|
Asian
|
55,750
|
9953
|
1234
|
0.876
|
|
Black/African American
|
29,215
|
9377
|
1434
|
0.847
|
|
Native Hawaiian or Pacific Islander
|
6,742
|
8679
|
1272
|
0.853
|
|
Hispanic/Latino Ethnicity
|
261,184
|
9143
|
1400
|
0.847
|
|
White
|
176,701
|
9433
|
1210
|
0.872
|
|
Two or More Races
|
35,476
|
10108
|
1256
|
0.876
|
|
Unidentified Race
|
31,334
|
10110
|
1211
|
0.880
|
|
EL status
|
115,453
|
7170
|
1573
|
0.781
|
|
IDEA Indicator
|
78,324
|
9274
|
1665
|
0.820
|
|
Section 504 Status
|
10,707
|
9150
|
1259
|
0.862
|
|
Economic Disadvantage Status
|
310,148
|
9235
|
1390
|
0.849
|
|
GRADE 4
|
Total
|
576,317
|
11349
|
1457
|
0.872
|
|
Female
|
263,059
|
11098
|
1449
|
0.869
|
|
Male
|
294,202
|
11522
|
1479
|
0.872
|
|
Native American or Alaska Native
|
6,335
|
9731
|
1446
|
0.851
|
|
Asian
|
56,223
|
10696
|
1456
|
0.864
|
|
Black/African American
|
30,628
|
10402
|
1557
|
0.850
|
|
Native Hawaiian or Pacific Islander
|
7,083
|
9997
|
1420
|
0.858
|
|
Hispanic/Latino Ethnicity
|
267,053
|
10130
|
1499
|
0.852
|
|
White
|
183,083
|
10186
|
1378
|
0.865
|
|
Two or More Races
|
35,328
|
10899
|
1429
|
0.869
|
|
Unidentified Race
|
32,197
|
11421
|
1393
|
0.878
|
|
EL status
|
111,051
|
7571
|
1660
|
0.781
|
|
IDEA Indicator
|
82,547
|
10342
|
1788
|
0.827
|
|
Section 504 Status
|
13,514
|
9580
|
1382
|
0.856
|
|
Economic Disadvantage Status
|
318,801
|
10242
|
1490
|
0.854
|
|
GRADE 5
|
Total
|
582,912
|
11974
|
1372
|
0.885
|
|
Female
|
266,594
|
11556
|
1368
|
0.882
|
|
Male
|
297,343
|
12249
|
1386
|
0.887
|
|
Native American or Alaska Native
|
6,468
|
10362
|
1334
|
0.871
|
|
Asian
|
58,533
|
10976
|
1475
|
0.866
|
|
Black/African American
|
31,546
|
11154
|
1417
|
0.873
|
|
Native Hawaiian or Pacific Islander
|
7,098
|
10280
|
1311
|
0.872
|
|
Hispanic/Latino Ethnicity
|
270,091
|
10610
|
1353
|
0.872
|
|
White
|
182,990
|
10789
|
1348
|
0.875
|
|
Two or More Races
|
34,510
|
11448
|
1389
|
0.879
|
|
Unidentified Race
|
32,977
|
11806
|
1335
|
0.887
|
|
EL status
|
98,076
|
7250
|
1497
|
0.793
|
|
IDEA Indicator
|
80,862
|
10272
|
1607
|
0.844
|
|
Section 504 Status
|
15,895
|
9945
|
1311
|
0.868
|
|
Economic Disadvantage Status
|
323,002
|
10812
|
1352
|
0.875
|
|
GRADE 6
|
Total
|
581,607
|
11075
|
1253
|
0.887
|
|
Female
|
265,831
|
10640
|
1237
|
0.884
|
|
Male
|
297,210
|
11236
|
1272
|
0.887
|
|
Native American or Alaska Native
|
6,302
|
9786
|
1282
|
0.869
|
|
Asian
|
57,409
|
9988
|
1285
|
0.871
|
|
Black/African American
|
31,446
|
10205
|
1319
|
0.871
|
|
Native Hawaiian or Pacific Islander
|
7,025
|
9779
|
1243
|
0.873
|
|
Hispanic/Latino Ethnicity
|
273,373
|
9877
|
1260
|
0.872
|
|
White
|
179,583
|
10087
|
1221
|
0.879
|
|
Two or More Races
|
33,072
|
10586
|
1244
|
0.882
|
|
Unidentified Race
|
34,286
|
11357
|
1232
|
0.892
|
|
EL status
|
87,383
|
6412
|
1448
|
0.774
|
|
IDEA Indicator
|
75,931
|
8707
|
1518
|
0.826
|
|
Section 504 Status
|
17,687
|
9070
|
1205
|
0.867
|
|
Economic Disadvantage Status
|
325,867
|
10042
|
1266
|
0.874
|
|
GRADE 7
|
Total
|
585,493
|
12724
|
1425
|
0.888
|
|
Female
|
266,922
|
11998
|
1390
|
0.884
|
|
Male
|
300,205
|
13105
|
1462
|
0.888
|
|
Native American or Alaska Native
|
6,311
|
11182
|
1480
|
0.868
|
|
Asian
|
53,659
|
11020
|
1441
|
0.869
|
|
Black/African American
|
31,644
|
11801
|
1534
|
0.870
|
|
Native Hawaiian or Pacific Islander
|
6,747
|
11083
|
1443
|
0.870
|
|
Hispanic/Latino Ethnicity
|
276,103
|
11527
|
1452
|
0.874
|
|
White
|
174,347
|
11265
|
1362
|
0.879
|
|
Two or More Races
|
30,663
|
12115
|
1393
|
0.885
|
|
Unidentified Race
|
47,295
|
13098
|
1434
|
0.891
|
|
EL status
|
79,642
|
7533
|
1788
|
0.763
|
|
IDEA Indicator
|
73,396
|
10125
|
1831
|
0.819
|
|
Section 504 Status
|
19,462
|
10549
|
1348
|
0.872
|
|
Economic Disadvantage Status
|
327,263
|
11719
|
1457
|
0.876
|
|
GRADE 8
|
Total
|
585,736
|
12988
|
1504
|
0.884
|
|
Female
|
266,664
|
12190
|
1453
|
0.881
|
|
Male
|
300,897
|
13363
|
1555
|
0.884
|
|
Native American or Alaska Native
|
6,205
|
11305
|
1554
|
0.863
|
|
Asian
|
52,108
|
11384
|
1464
|
0.871
|
|
Black/African American
|
30,616
|
12108
|
1655
|
0.863
|
|
Native Hawaiian or Pacific Islander
|
6,629
|
11032
|
1486
|
0.865
|
|
Hispanic/Latino Ethnicity
|
271,511
|
11721
|
1559
|
0.867
|
|
White
|
165,425
|
11890
|
1424
|
0.880
|
|
Two or More Races
|
28,072
|
12569
|
1460
|
0.884
|
|
Unidentified Race
|
65,848
|
12753
|
1458
|
0.886
|
|
EL status
|
68,876
|
7308
|
2033
|
0.722
|
|
IDEA Indicator
|
70,650
|
9651
|
2004
|
0.792
|
|
Section 504 Status
|
20,808
|
10935
|
1417
|
0.870
|
|
Economic Disadvantage Status
|
326,763
|
11942
|
1560
|
0.869
|
|
HIGH SCHOOL
|
Total
|
590,020
|
15495
|
1799
|
0.884
|
|
Female
|
271,059
|
13821
|
1715
|
0.876
|
|
Male
|
303,414
|
16539
|
1878
|
0.886
|
|
Native American or Alaska Native
|
5,509
|
13793
|
1828
|
0.867
|
|
Asian
|
49,679
|
12981
|
1750
|
0.865
|
|
Black/African American
|
23,879
|
15162
|
1962
|
0.871
|
|
Native Hawaiian or Pacific Islander
|
5,090
|
12837
|
1786
|
0.861
|
|
Hispanic/Latino Ethnicity
|
262,828
|
14695
|
1847
|
0.874
|
|
White
|
136,654
|
14932
|
1746
|
0.883
|
|
Two or More Races
|
22,292
|
15138
|
1760
|
0.884
|
|
Unidentified Race
|
113,397
|
14378
|
1757
|
0.878
|
|
EL status
|
62,191
|
8615
|
2507
|
0.709
|
|
IDEA Indicator
|
65,082
|
11581
|
2348
|
0.797
|
|
Section 504 Status
|
26,860
|
13543
|
1720
|
0.873
|
|
Economic Disadvantage Status
|
329,559
|
14802
|
1854
|
0.875
|
Table 8.20: MARGINAL RELIABILITY OF TOTAL SUMMATIVE SCORES: MATHEMATICS
|
Grade
|
Group
|
N
|
Var
|
MSE
|
Rho
|
|
GRADE 3
|
Total
|
567,862
|
8668
|
802
|
0.907
|
|
Female
|
260,111
|
8222
|
786
|
0.904
|
|
Male
|
289,235
|
9046
|
813
|
0.910
|
|
Native American or Alaska Native
|
5,751
|
7793
|
904
|
0.884
|
|
Asian
|
56,882
|
8068
|
791
|
0.902
|
|
Black/African American
|
29,284
|
7990
|
959
|
0.880
|
|
Native Hawaiian or Pacific Islander
|
6,776
|
7426
|
839
|
0.887
|
|
Hispanic/Latino Ethnicity
|
265,058
|
7447
|
839
|
0.887
|
|
White
|
177,632
|
7863
|
743
|
0.905
|
|
Two or More Races
|
35,585
|
8532
|
756
|
0.911
|
|
Unidentified Race
|
32,372
|
8903
|
870
|
0.902
|
|
EL status
|
122,309
|
6674
|
947
|
0.858
|
|
IDEA Indicator
|
78,322
|
9431
|
1169
|
0.876
|
|
Section 504 Status
|
10,801
|
7797
|
762
|
0.902
|
|
Economic Disadvantage Status
|
314,132
|
7687
|
847
|
0.890
|
|
GRADE 4
|
Total
|
582,267
|
9074
|
880
|
0.903
|
|
Female
|
265,746
|
8448
|
855
|
0.899
|
|
Male
|
297,391
|
9624
|
901
|
0.906
|
|
Native American or Alaska Native
|
6,378
|
7955
|
1018
|
0.872
|
|
Asian
|
57,247
|
8491
|
859
|
0.899
|
|
Black/African American
|
30,662
|
8063
|
1077
|
0.866
|
|
Native Hawaiian or Pacific Islander
|
7,115
|
7704
|
916
|
0.881
|
|
Hispanic/Latino Ethnicity
|
270,765
|
7594
|
933
|
0.877
|
|
White
|
183,869
|
8155
|
792
|
0.903
|
|
Two or More Races
|
35,452
|
8908
|
821
|
0.908
|
|
Unidentified Race
|
33,190
|
9297
|
934
|
0.899
|
|
EL status
|
117,500
|
6561
|
1102
|
0.832
|
|
IDEA Indicator
|
82,452
|
9322
|
1381
|
0.852
|
|
Section 504 Status
|
13,573
|
7709
|
781
|
0.899
|
|
Economic Disadvantage Status
|
322,356
|
7889
|
943
|
0.880
|
|
GRADE 5
|
Total
|
588,105
|
10928
|
1206
|
0.890
|
|
Female
|
268,926
|
10264
|
1191
|
0.884
|
|
Male
|
300,124
|
11556
|
1218
|
0.895
|
|
Native American or Alaska Native
|
6,490
|
9403
|
1451
|
0.846
|
|
Asian
|
59,441
|
9988
|
1006
|
0.899
|
|
Black/African American
|
31,578
|
9613
|
1548
|
0.839
|
|
Native Hawaiian or Pacific Islander
|
7,110
|
8900
|
1251
|
0.859
|
|
Hispanic/Latino Ethnicity
|
273,312
|
9023
|
1342
|
0.851
|
|
White
|
183,561
|
9865
|
1053
|
0.893
|
|
Two or More Races
|
34,585
|
10811
|
1062
|
0.902
|
|
Unidentified Race
|
33,987
|
10857
|
1226
|
0.887
|
|
EL status
|
103,801
|
7060
|
1680
|
0.762
|
|
IDEA Indicator
|
80,792
|
9999
|
1937
|
0.806
|
|
Section 504 Status
|
15,983
|
9341
|
1077
|
0.885
|
|
Economic Disadvantage Status
|
326,154
|
9438
|
1349
|
0.857
|
|
GRADE 6
|
Total
|
585,884
|
13673
|
1624
|
0.881
|
|
Female
|
267,799
|
13093
|
1594
|
0.878
|
|
Male
|
299,452
|
14230
|
1656
|
0.884
|
|
Native American or Alaska Native
|
6,329
|
11701
|
1910
|
0.837
|
|
Asian
|
58,273
|
12644
|
1243
|
0.902
|
|
Black/African American
|
31,377
|
11710
|
2196
|
0.812
|
|
Native Hawaiian or Pacific Islander
|
7,050
|
11571
|
1690
|
0.854
|
|
Hispanic/Latino Ethnicity
|
276,213
|
11432
|
1885
|
0.835
|
|
White
|
180,008
|
12072
|
1311
|
0.891
|
|
Two or More Races
|
33,103
|
13128
|
1380
|
0.895
|
|
Unidentified Race
|
35,211
|
13962
|
1579
|
0.887
|
|
EL status
|
92,635
|
8676
|
2653
|
0.694
|
|
IDEA Indicator
|
75,650
|
11629
|
3095
|
0.734
|
|
Section 504 Status
|
17,722
|
11198
|
1323
|
0.882
|
|
Economic Disadvantage Status
|
328,577
|
11891
|
1883
|
0.842
|
|
GRADE 7
|
Total
|
588,474
|
14789
|
1846
|
0.875
|
|
Female
|
268,264
|
14273
|
1838
|
0.871
|
|
Male
|
301,906
|
15273
|
1849
|
0.879
|
|
Native American or Alaska Native
|
6,316
|
12098
|
2202
|
0.818
|
|
Asian
|
54,313
|
14378
|
1364
|
0.905
|
|
Black/African American
|
31,522
|
11662
|
2397
|
0.794
|
|
Native Hawaiian or Pacific Islander
|
6,770
|
11709
|
2101
|
0.821
|
|
Hispanic/Latino Ethnicity
|
278,217
|
11927
|
2135
|
0.821
|
|
White
|
174,446
|
12966
|
1538
|
0.881
|
|
Two or More Races
|
30,666
|
14582
|
1582
|
0.892
|
|
Unidentified Race
|
48,017
|
16267
|
1813
|
0.889
|
|
EL status
|
84,225
|
8645
|
3066
|
0.645
|
|
IDEA Indicator
|
73,004
|
11197
|
3258
|
0.709
|
|
Section 504 Status
|
19,461
|
12376
|
1578
|
0.872
|
|
Economic Disadvantage Status
|
329,006
|
12440
|
2129
|
0.829
|
|
GRADE 8
|
Total
|
588,081
|
17201
|
2116
|
0.877
|
|
Female
|
267,772
|
16376
|
2060
|
0.874
|
|
Male
|
302,265
|
18080
|
2158
|
0.881
|
|
Native American or Alaska Native
|
6,190
|
13323
|
2646
|
0.801
|
|
Asian
|
52,635
|
17873
|
1595
|
0.911
|
|
Black/African American
|
30,525
|
12829
|
2662
|
0.792
|
|
Native Hawaiian or Pacific Islander
|
6,645
|
12949
|
2362
|
0.818
|
|
Hispanic/Latino Ethnicity
|
273,231
|
13463
|
2393
|
0.822
|
|
White
|
165,360
|
15592
|
1879
|
0.880
|
|
Two or More Races
|
28,042
|
17603
|
1853
|
0.895
|
|
Unidentified Race
|
66,488
|
17631
|
2035
|
0.885
|
|
EL status
|
72,910
|
9112
|
3365
|
0.631
|
|
IDEA Indicator
|
70,275
|
11256
|
3418
|
0.696
|
|
Section 504 Status
|
20,819
|
14426
|
1920
|
0.867
|
|
Economic Disadvantage Status
|
327,973
|
14189
|
2389
|
0.832
|
|
HIGH SCHOOL
|
Total
|
597,196
|
18174
|
2838
|
0.844
|
|
Female
|
275,514
|
16380
|
2720
|
0.834
|
|
Male
|
306,465
|
19960
|
2964
|
0.852
|
|
Native American or Alaska Native
|
5,435
|
13869
|
3106
|
0.776
|
|
Asian
|
49,689
|
19255
|
1748
|
0.909
|
|
Black/African American
|
23,599
|
13742
|
3814
|
0.722
|
|
Native Hawaiian or Pacific Islander
|
5,063
|
13144
|
2781
|
0.788
|
|
Hispanic/Latino Ethnicity
|
262,473
|
14098
|
3333
|
0.764
|
|
White
|
136,002
|
17936
|
2344
|
0.869
|
|
Two or More Races
|
22,212
|
19733
|
2385
|
0.879
|
|
Unidentified Race
|
121,636
|
16682
|
2652
|
0.841
|
|
EL status
|
64,229
|
9377
|
5106
|
0.455
|
|
IDEA Indicator
|
64,664
|
10618
|
5212
|
0.509
|
|
Section 504 Status
|
27,251
|
16180
|
2525
|
0.844
|
|
Economic Disadvantage Status
|
331,906
|
14812
|
3294
|
0.778
|
Classification Accuracy
Classification accuracy measures how accurately test scores place students into reporting category levels. The likelihood of inaccurate placement depends on the amount of measurement error associated with scores, especially those nearest cut points, and on the distribution of student achievement.
Table 8.21 and Table 8.22
show classification accuracy of the total score achievement levels in ELA/literacy and mathematics, respectively, for each grade 3-8 and high school (HS). Section 2.4 explains how the statistics in these tables were computed. Classification accuracy for each category was high to moderately high for all grades.
Table 8.21: CLASSIFICATION ACCURACY OF TOTAL ELA/LITERACY SCORES
|
Grade
|
Observed Level
|
N
|
P
|
True L1
|
True L2
|
True L3
|
True L4
|
Accuracy by Level
|
Accuracy Overall
|
|
GRADE 3
|
1
|
188,816
|
0.336
|
0.294
|
0.041
|
0.001
|
0.000
|
0.875
|
0.753
|
|
2
|
127,749
|
0.228
|
0.043
|
0.141
|
0.042
|
0.001
|
0.618
|
|
3
|
112,310
|
0.200
|
0.001
|
0.043
|
0.117
|
0.040
|
0.583
|
|
4
|
132,560
|
0.236
|
0.000
|
0.001
|
0.034
|
0.201
|
0.852
|
|
GRADE 4
|
1
|
207,268
|
0.360
|
0.318
|
0.039
|
0.002
|
0.000
|
0.885
|
0.747
|
|
2
|
110,999
|
0.193
|
0.044
|
0.105
|
0.042
|
0.002
|
0.545
|
|
3
|
115,896
|
0.201
|
0.002
|
0.043
|
0.115
|
0.041
|
0.572
|
|
4
|
142,154
|
0.247
|
0.000
|
0.002
|
0.036
|
0.209
|
0.846
|
|
GRADE 5
|
1
|
187,294
|
0.321
|
0.286
|
0.034
|
0.001
|
0.000
|
0.889
|
0.761
|
|
2
|
112,813
|
0.194
|
0.040
|
0.113
|
0.040
|
0.000
|
0.584
|
|
3
|
150,197
|
0.258
|
0.002
|
0.044
|
0.172
|
0.040
|
0.669
|
|
4
|
132,608
|
0.227
|
0.000
|
0.000
|
0.037
|
0.190
|
0.835
|
|
GRADE 6
|
1
|
172,384
|
0.296
|
0.261
|
0.035
|
0.000
|
0.000
|
0.879
|
0.766
|
|
2
|
141,700
|
0.244
|
0.040
|
0.162
|
0.041
|
0.000
|
0.666
|
|
3
|
163,496
|
0.281
|
0.000
|
0.045
|
0.197
|
0.039
|
0.701
|
|
4
|
104,027
|
0.179
|
0.000
|
0.000
|
0.032
|
0.146
|
0.817
|
|
GRADE 7
|
1
|
175,852
|
0.300
|
0.266
|
0.033
|
0.001
|
0.000
|
0.887
|
0.772
|
|
2
|
129,555
|
0.221
|
0.038
|
0.143
|
0.040
|
0.000
|
0.645
|
|
3
|
179,228
|
0.306
|
0.001
|
0.044
|
0.223
|
0.038
|
0.728
|
|
4
|
100,858
|
0.172
|
0.000
|
0.000
|
0.032
|
0.140
|
0.813
|
|
GRADE 8
|
1
|
171,789
|
0.293
|
0.259
|
0.034
|
0.000
|
0.000
|
0.882
|
0.772
|
|
2
|
142,582
|
0.243
|
0.039
|
0.162
|
0.042
|
0.000
|
0.666
|
|
3
|
178,963
|
0.306
|
0.000
|
0.045
|
0.223
|
0.037
|
0.731
|
|
4
|
92,402
|
0.158
|
0.000
|
0.000
|
0.030
|
0.128
|
0.811
|
|
HIGH SCHOOL
|
1
|
135,833
|
0.230
|
0.201
|
0.029
|
0.000
|
0.000
|
0.872
|
0.771
|
|
2
|
124,504
|
0.211
|
0.032
|
0.141
|
0.037
|
0.000
|
0.669
|
|
3
|
176,825
|
0.300
|
0.000
|
0.044
|
0.212
|
0.044
|
0.706
|
|
4
|
152,858
|
0.259
|
0.000
|
0.000
|
0.042
|
0.217
|
0.839
|
Table 8.22: CLASSIFICATION ACCURACY OF TOTAL MATHEMATICS SCORES
|
Grade
|
Observed Level
|
N
|
P
|
True L1
|
True L2
|
True L3
|
True L4
|
Accuracy by Level
|
Accuracy Overall
|
|
GRADE 3
|
1
|
180,938
|
0.319
|
0.283
|
0.035
|
0.001
|
0.000
|
0.889
|
0.793
|
|
2
|
123,878
|
0.218
|
0.037
|
0.144
|
0.038
|
0.000
|
0.658
|
|
3
|
142,771
|
0.251
|
0.000
|
0.038
|
0.182
|
0.031
|
0.725
|
|
4
|
120,275
|
0.212
|
0.000
|
0.000
|
0.027
|
0.184
|
0.870
|
|
GRADE 4
|
1
|
172,464
|
0.296
|
0.260
|
0.036
|
0.000
|
0.000
|
0.877
|
0.798
|
|
2
|
163,553
|
0.281
|
0.038
|
0.206
|
0.037
|
0.000
|
0.732
|
|
3
|
132,196
|
0.227
|
0.000
|
0.036
|
0.162
|
0.029
|
0.713
|
|
4
|
114,054
|
0.196
|
0.000
|
0.000
|
0.025
|
0.170
|
0.870
|
|
GRADE 5
|
1
|
229,940
|
0.391
|
0.345
|
0.045
|
0.001
|
0.000
|
0.883
|
0.791
|
|
2
|
145,396
|
0.247
|
0.040
|
0.170
|
0.037
|
0.001
|
0.688
|
|
3
|
92,597
|
0.157
|
0.000
|
0.032
|
0.097
|
0.028
|
0.616
|
|
4
|
120,172
|
0.204
|
0.000
|
0.001
|
0.025
|
0.179
|
0.877
|
|
GRADE 6
|
1
|
234,125
|
0.400
|
0.357
|
0.042
|
0.001
|
0.000
|
0.894
|
0.795
|
|
2
|
148,721
|
0.254
|
0.040
|
0.176
|
0.037
|
0.001
|
0.693
|
|
3
|
94,833
|
0.162
|
0.000
|
0.033
|
0.101
|
0.028
|
0.623
|
|
4
|
108,205
|
0.185
|
0.000
|
0.000
|
0.023
|
0.161
|
0.873
|
|
GRADE 7
|
1
|
238,331
|
0.405
|
0.358
|
0.046
|
0.001
|
0.000
|
0.885
|
0.791
|
|
2
|
146,504
|
0.249
|
0.042
|
0.167
|
0.039
|
0.001
|
0.671
|
|
3
|
102,128
|
0.174
|
0.000
|
0.033
|
0.114
|
0.027
|
0.657
|
|
4
|
101,511
|
0.172
|
0.000
|
0.000
|
0.020
|
0.152
|
0.880
|
|
GRADE 8
|
1
|
269,080
|
0.458
|
0.405
|
0.051
|
0.002
|
0.000
|
0.885
|
0.792
|
|
2
|
131,327
|
0.223
|
0.044
|
0.140
|
0.038
|
0.001
|
0.627
|
|
3
|
82,085
|
0.140
|
0.000
|
0.028
|
0.087
|
0.024
|
0.621
|
|
4
|
105,589
|
0.180
|
0.000
|
0.000
|
0.019
|
0.161
|
0.895
|
|
HIGH SCHOOL
|
1
|
305,422
|
0.511
|
0.454
|
0.056
|
0.002
|
0.000
|
0.887
|
0.806
|
|
2
|
129,572
|
0.217
|
0.042
|
0.140
|
0.036
|
0.000
|
0.643
|
|
3
|
93,003
|
0.156
|
0.000
|
0.026
|
0.111
|
0.019
|
0.711
|
|
4
|
69,199
|
0.116
|
0.000
|
0.000
|
0.014
|
0.102
|
0.883
|
Standard Errors of Measurement
The standard error of measurement (SEM) information in this section is based on student scores and associated SEMs included in the data Smarter Balanced receives from members after the administration. All of the SEM statistics reported here are based on the adjusted (shortened) blueprint and in the reporting scale metric.
Table 8.23 and Table 8.24 show the trend in the SEM by student decile for ELA/literacy and mathematics, respectively. Deciles were defined by ranking students from highest to lowest scale score and dividing the students into 10 equal-sized groups according to rank. Decile 1 contains the 10% of students with the lowest scale scores. Decile 10 contains the 10% of students with the highest scale scores. The SEM reported for a decile is the average SEM among examinees at that decile.
Table 8.23: AVERAGE SEM BY DECILE: ELA/LITERACY
|
Subject
|
Grade
|
Mean
|
d1
|
d2
|
d3
|
d4
|
d5
|
d6
|
d7
|
d8
|
d9
|
d10
|
|
ELA/LITERACY
|
GRADE 3
|
35.2
|
52.2
|
37.7
|
34.4
|
32.8
|
31.8
|
31.2
|
31.3
|
31.5
|
32.4
|
35.2
|
|
GRADE 4
|
37.4
|
51.5
|
38.5
|
36.1
|
35.1
|
34.3
|
33.8
|
33.3
|
34.0
|
35.3
|
39.4
|
|
GRADE 5
|
36.3
|
47.7
|
35.6
|
33.3
|
32.4
|
32.4
|
32.8
|
33.4
|
34.6
|
36.7
|
41.5
|
|
GRADE 6
|
34.9
|
46.1
|
35.5
|
32.7
|
31.5
|
31.1
|
31.6
|
32.5
|
33.5
|
34.8
|
37.8
|
|
GRADE 7
|
36.9
|
52.3
|
38.5
|
35.0
|
33.3
|
32.7
|
32.9
|
33.2
|
34.0
|
35.8
|
39.5
|
|
GRADE 8
|
37.8
|
56.5
|
38.9
|
35.0
|
33.9
|
33.9
|
34.0
|
34.2
|
34.7
|
36.0
|
39.3
|
|
HIGH SCHOOL
|
41.4
|
61.0
|
43.4
|
39.1
|
37.4
|
36.8
|
36.4
|
37.2
|
37.9
|
39.7
|
42.7
|
Table 8.24: AVERAGE SEM BY DECILE: MATHEMATICS
|
Subject
|
Grade
|
Mean
|
d1
|
d2
|
d3
|
d4
|
d5
|
d6
|
d7
|
d8
|
d9
|
d10
|
|
MATHEMATICS
|
GRADE 3
|
27.0
|
43.8
|
30.1
|
26.7
|
24.8
|
23.7
|
23.0
|
22.6
|
22.4
|
23.4
|
26.5
|
|
GRADE 4
|
28.0
|
46.4
|
31.0
|
27.6
|
25.9
|
24.8
|
24.0
|
23.2
|
23.1
|
23.2
|
26.2
|
|
GRADE 5
|
32.9
|
55.7
|
40.2
|
36.3
|
33.3
|
30.4
|
27.9
|
25.9
|
24.8
|
24.4
|
26.1
|
|
GRADE 6
|
36.9
|
71.9
|
45.0
|
38.7
|
34.7
|
32.1
|
30.4
|
28.9
|
27.8
|
27.4
|
29.6
|
|
GRADE 7
|
39.7
|
75.2
|
48.4
|
42.3
|
39.0
|
36.4
|
34.1
|
31.6
|
29.5
|
28.1
|
29.5
|
|
GRADE 8
|
43.5
|
76.4
|
52.0
|
46.7
|
44.3
|
42.4
|
39.8
|
36.5
|
32.6
|
29.6
|
31.0
|
|
HIGH SCHOOL
|
48.8
|
98.0
|
64.7
|
54.9
|
48.9
|
44.4
|
41.0
|
37.7
|
34.6
|
31.4
|
30.6
|
Table 8.25 and Table 8.26 show the average SEM near the achievement level cut scores. The average SEM reported for a given cut score is the average SEM among students within 10 scale score units of the cut score. In the column headings, “Cut1” is the lowest cut score defining the lower boundary of level 2, “Cut2” defines the lower boundary of level 3, and “Cut3” defines the lower boundary of level 4.
Table 8.25: SEM WITHIN 10 POINTS OF ACHIEVEMENT LEVEL CUT SCORES: ELA/LITERACY
|
Subject
|
Grade
|
Cut1v2_N
|
Cut1v2_M
|
Cut1v2_SD
|
Cut2v3_N
|
Cut2v3_M
|
Cut2v3_SD
|
Cut3v4_N
|
Cut3v4_M
|
Cut3v4_SD
|
|
ELA/LITERACY
|
GRADE 3
|
38,722
|
32.9
|
1.98
|
42,572
|
31.2
|
1.50
|
35,907
|
31.5
|
1.74
|
|
ELA/LITERACY
|
GRADE 4
|
38,051
|
35.0
|
2.16
|
42,544
|
33.8
|
1.76
|
36,736
|
34.1
|
1.58
|
|
ELA/LITERACY
|
GRADE 5
|
36,314
|
32.4
|
1.97
|
41,492
|
32.5
|
1.71
|
34,995
|
34.9
|
1.93
|
|
ELA/LITERACY
|
GRADE 6
|
36,554
|
32.0
|
1.72
|
42,481
|
31.4
|
1.59
|
33,126
|
34.4
|
1.72
|
|
ELA/LITERACY
|
GRADE 7
|
32,804
|
33.8
|
1.80
|
40,417
|
32.7
|
1.92
|
31,659
|
35.3
|
1.69
|
|
ELA/LITERACY
|
GRADE 8
|
32,645
|
34.1
|
1.84
|
39,804
|
34.0
|
1.52
|
29,595
|
35.8
|
1.81
|
|
ELA/LITERACY
|
HIGH SCHOOL
|
23,895
|
39.5
|
2.52
|
34,718
|
36.8
|
2.18
|
36,147
|
37.9
|
1.89
|
Table 8.26: SEM WITHIN 10 POINTS OF ACHIEVEMENT LEVEL CUT SCORES: MATHEMATICS
|
Subject
|
Grade
|
Cut1v2_N
|
Cut1v2_M
|
Cut1v2_SD
|
Cut2v3_N
|
Cut2v3_M
|
Cut2v3_SD
|
Cut3v4_N
|
Cut3v4_M
|
Cut3v4_SD
|
|
MATHEMATICS
|
GRADE 3
|
42,543
|
25.2
|
1.27
|
49,928
|
23.0
|
1.00
|
38,690
|
22.6
|
1.30
|
|
MATHEMATICS
|
GRADE 4
|
42,711
|
26.6
|
1.47
|
47,317
|
23.8
|
1.19
|
36,346
|
23.1
|
1.15
|
|
MATHEMATICS
|
GRADE 5
|
41,563
|
32.0
|
1.70
|
41,708
|
26.1
|
1.55
|
33,754
|
24.5
|
1.61
|
|
MATHEMATICS
|
GRADE 6
|
37,611
|
33.2
|
1.66
|
38,124
|
28.8
|
1.51
|
29,310
|
27.4
|
1.59
|
|
MATHEMATICS
|
GRADE 7
|
37,117
|
37.4
|
1.94
|
35,656
|
31.5
|
2.04
|
25,450
|
28.4
|
2.12
|
|
MATHEMATICS
|
GRADE 8
|
36,556
|
42.1
|
2.36
|
29,907
|
35.2
|
2.47
|
21,539
|
30.0
|
3.24
|
|
MATHEMATICS
|
HIGH SCHOOL
|
35,521
|
42.1
|
2.49
|
27,342
|
35.1
|
2.41
|
16,163
|
30.2
|
2.27
|
Figure 8.1 to Figure 8.14 provide scatter plots of a random sample of 2,000 individual student SEMs from the adjusted blueprint as a function of total scale score by grade within subject. Dashed vertical lines in Figure 8.1 to Figure 8.14 represent the achievement level cut scores. The plots for the high school standard errors show cut scores for each grade 9, 10, and 11, separately.
Overall Score and Achievement Level Results
Two kinds of results are reported in the tables of this section: 1) summary statistics for overall scale scores and 2) achievement level percentages. The overall scale scores provide a numerical representation of student achievement along the assessment continuum. The achievement level percentages show the distribution of students across performance levels, which reflect varying degrees of college and career readiness.
Table 8.27 to Table 8.40 show by grade and subject the number of students in total and by demographic group in the reporting states, the mean and standard deviation of their overall scale score, the percentage of students in each achievement level, and the percentage of students in levels 3 and 4 combined. Levels 3 and 4 are combined to show the total percentage of students who are on track for college and career readiness.
Table 8.27: GRADE 3 ELA/LITERACY AVERAGE OVERALL SCALE SCORE AND PERCENTAGE IN EACH ACHIEVEMENT LEVEL BY SELECTED DEMOGRAPHIC GROUPS , 2023-24 ADMINISTRATION
|
Group
|
Scale Scores
N
|
Scale Scores
Mean
|
Scale Scores
SD
|
Achievement
Levels(%) 1
|
Achievement
Levels(%) 2
|
Achievement
Levels(%) 3
|
Achievement
Levels(%) 4
|
Achievement
Levels(%)3&4
|
|
Total
|
561,435
|
2412
|
101.6
|
33.6
|
22.8
|
20.0
|
23.6
|
43.6
|
|
Female
|
257,137
|
2420
|
100.9
|
30.4
|
22.7
|
20.9
|
26.0
|
46.9
|
|
Male
|
285,915
|
2404
|
101.9
|
36.5
|
22.8
|
19.1
|
21.5
|
40.7
|
|
American Indian or Alaska Native
|
5,725
|
2373
|
94.5
|
49.1
|
23.2
|
15.9
|
11.7
|
27.7
|
|
Asian
|
55,750
|
2467
|
99.8
|
16.5
|
17.0
|
21.3
|
45.2
|
66.5
|
|
Black/African American
|
29,215
|
2375
|
96.8
|
47.8
|
23.3
|
16.0
|
12.9
|
28.9
|
|
Native Hawaiian or Pacific Islander
|
6,742
|
2379
|
93.2
|
45.2
|
25.1
|
17.7
|
12.0
|
29.7
|
|
Hispanic/Latino Ethnicity
|
261,184
|
2384
|
95.6
|
43.5
|
24.7
|
17.7
|
14.2
|
31.8
|
|
White
|
176,701
|
2432
|
97.1
|
25.3
|
22.2
|
23.0
|
29.5
|
52.5
|
|
Two or More Races
|
35,476
|
2440
|
100.5
|
23.6
|
20.8
|
22.1
|
33.5
|
55.6
|
|
Unidentified Race
|
31,334
|
2402
|
100.5
|
37.2
|
23.1
|
18.8
|
20.9
|
39.8
|
|
EL Status
|
115,453
|
2347
|
84.7
|
59.7
|
24.0
|
11.4
|
4.8
|
16.2
|
|
IDEA Indicator
|
78,324
|
2347
|
96.3
|
61.4
|
19.3
|
10.7
|
8.6
|
19.3
|
|
Section 504 Status
|
10,707
|
2419
|
95.7
|
30.0
|
23.9
|
21.7
|
24.4
|
46.1
|
|
Economic Disadvantage Status
|
310,148
|
2385
|
96.1
|
43.3
|
24.5
|
17.6
|
14.5
|
32.1
|
Table 8.28: GRADE 4 ELA/LITERACY AVERAGE OVERALL SCALE SCORE AND PERCENTAGE IN EACH ACHIEVEMENT LEVEL BY SELECTED DEMOGRAPHIC GROUPS , 2023-24 ADMINISTRATION
|
Group
|
Scale Scores
N
|
Scale Scores
Mean
|
Scale Scores
SD
|
Achievement
Levels(%) 1
|
Achievement
Levels(%) 2
|
Achievement
Levels(%) 3
|
Achievement
Levels(%) 4
|
Achievement
Levels(%)3&4
|
|
Total
|
576,317
|
2454
|
106.5
|
36.0
|
19.3
|
20.1
|
24.7
|
44.8
|
|
Female
|
263,059
|
2462
|
105.3
|
33.0
|
19.3
|
20.9
|
26.9
|
47.7
|
|
Male
|
294,202
|
2447
|
107.3
|
38.7
|
19.2
|
19.4
|
22.8
|
42.1
|
|
American Indian or Alaska Native
|
6,335
|
2415
|
98.6
|
50.7
|
21.1
|
16.0
|
12.3
|
28.2
|
|
Asian
|
56,223
|
2515
|
103.4
|
17.1
|
13.5
|
21.1
|
48.3
|
69.4
|
|
Black/African American
|
30,628
|
2412
|
102.0
|
52.2
|
19.4
|
15.6
|
12.8
|
28.4
|
|
Native Hawaiian or Pacific Islander
|
7,083
|
2421
|
100.0
|
48.7
|
20.1
|
17.2
|
14.0
|
31.2
|
|
Hispanic/Latino Ethnicity
|
267,053
|
2425
|
100.6
|
46.3
|
20.9
|
18.0
|
14.8
|
32.8
|
|
White
|
183,083
|
2476
|
100.9
|
27.1
|
19.2
|
23.0
|
30.7
|
53.8
|
|
Two or More Races
|
35,328
|
2484
|
104.4
|
25.4
|
17.9
|
22.0
|
34.7
|
56.7
|
|
Unidentified Race
|
32,197
|
2447
|
106.9
|
38.6
|
19.2
|
19.4
|
22.8
|
42.1
|
|
EL Status
|
111,051
|
2379
|
87.0
|
65.9
|
19.7
|
10.7
|
3.8
|
14.5
|
|
IDEA Indicator
|
82,547
|
2377
|
101.7
|
67.2
|
15.0
|
9.9
|
7.9
|
17.8
|
|
Section 504 Status
|
13,514
|
2465
|
97.9
|
30.9
|
21.0
|
22.5
|
25.6
|
48.1
|
|
Economic Disadvantage Status
|
318,801
|
2425
|
101.2
|
46.1
|
20.8
|
18.0
|
15.2
|
33.2
|
Table 8.29: GRADE 5 ELA/LITERACY AVERAGE OVERALL SCALE SCORE AND PERCENTAGE IN EACH ACHIEVEMENT LEVEL BY SELECTED DEMOGRAPHIC GROUPS , 2023-24 ADMINISTRATION
|
Group
|
Scale Scores
N
|
Scale Scores
Mean
|
Scale Scores
SD
|
Achievement
Levels(%) 1
|
Achievement
Levels(%) 2
|
Achievement
Levels(%) 3
|
Achievement
Levels(%) 4
|
Achievement
Levels(%)3&4
|
|
Total
|
582,912
|
2493
|
109.4
|
32.1
|
19.4
|
25.8
|
22.7
|
48.5
|
|
Female
|
266,594
|
2503
|
107.5
|
28.6
|
19.6
|
26.6
|
25.2
|
51.9
|
|
Male
|
297,343
|
2484
|
110.7
|
35.5
|
19.1
|
24.8
|
20.5
|
45.4
|
|
American Indian or Alaska Native
|
6,468
|
2451
|
101.8
|
47.0
|
21.0
|
21.3
|
10.7
|
32.0
|
|
Asian
|
58,533
|
2558
|
104.8
|
14.3
|
12.2
|
26.6
|
46.9
|
73.5
|
|
Black/African American
|
31,546
|
2449
|
105.6
|
48.2
|
20.2
|
20.4
|
11.3
|
31.7
|
|
Native Hawaiian or Pacific Islander
|
7,098
|
2460
|
101.4
|
42.3
|
22.5
|
23.1
|
12.1
|
35.2
|
|
Hispanic/Latino Ethnicity
|
270,091
|
2463
|
103.0
|
41.9
|
21.8
|
23.4
|
13.0
|
36.3
|
|
White
|
182,990
|
2515
|
103.9
|
23.7
|
18.4
|
29.3
|
28.6
|
57.9
|
|
Two or More Races
|
34,510
|
2524
|
107.0
|
22.4
|
17.1
|
27.8
|
32.8
|
60.6
|
|
Unidentified Race
|
32,977
|
2486
|
108.7
|
34.5
|
19.5
|
25.4
|
20.6
|
46.1
|
|
EL Status
|
98,076
|
2403
|
85.1
|
67.0
|
20.7
|
10.5
|
1.8
|
12.3
|
|
IDEA Indicator
|
80,862
|
2403
|
101.4
|
67.4
|
15.6
|
11.4
|
5.6
|
17.0
|
|
Section 504 Status
|
15,895
|
2505
|
99.7
|
26.6
|
20.4
|
29.3
|
23.7
|
53.0
|
|
Economic Disadvantage Status
|
323,002
|
2464
|
104.0
|
41.6
|
21.5
|
23.4
|
13.5
|
36.9
|
Table 8.30: GRADE 6 ELA/LITERACY AVERAGE OVERALL SCALE SCORE AND PERCENTAGE IN EACH ACHIEVEMENT LEVEL BY SELECTED DEMOGRAPHIC GROUPS , 2023-24 ADMINISTRATION
|
Group
|
Scale Scores
N
|
Scale Scores
Mean
|
Scale Scores
SD
|
Achievement
Levels(%) 1
|
Achievement
Levels(%) 2
|
Achievement
Levels(%) 3
|
Achievement
Levels(%) 4
|
Achievement
Levels(%)3&4
|
|
Total
|
581,607
|
2515
|
105.2
|
29.6
|
24.4
|
28.1
|
17.9
|
46.0
|
|
Female
|
265,831
|
2528
|
103.1
|
25.1
|
24.1
|
29.8
|
21.0
|
50.8
|
|
Male
|
297,210
|
2503
|
106.0
|
33.8
|
24.5
|
26.5
|
15.2
|
41.7
|
|
American Indian or Alaska Native
|
6,302
|
2470
|
98.9
|
45.4
|
26.3
|
21.2
|
7.1
|
28.3
|
|
Asian
|
57,409
|
2581
|
99.9
|
12.1
|
15.0
|
31.9
|
41.0
|
72.9
|
|
Black/African American
|
31,446
|
2471
|
101.0
|
45.7
|
25.6
|
20.6
|
8.1
|
28.7
|
|
Native Hawaiian or Pacific Islander
|
7,025
|
2483
|
98.9
|
40.3
|
26.7
|
23.7
|
9.2
|
33.0
|
|
Hispanic/Latino Ethnicity
|
273,373
|
2488
|
99.4
|
38.0
|
27.4
|
24.7
|
9.9
|
34.6
|
|
White
|
179,583
|
2534
|
100.4
|
22.4
|
23.5
|
32.2
|
21.9
|
54.1
|
|
Two or More Races
|
33,072
|
2542
|
102.9
|
20.8
|
21.8
|
31.6
|
25.7
|
57.3
|
|
Unidentified Race
|
34,286
|
2507
|
106.6
|
32.7
|
24.2
|
26.8
|
16.4
|
43.1
|
|
EL Status
|
87,383
|
2420
|
80.1
|
67.3
|
24.3
|
7.7
|
0.7
|
8.4
|
|
IDEA Indicator
|
75,931
|
2422
|
93.3
|
67.7
|
19.4
|
9.7
|
3.2
|
12.9
|
|
Section 504 Status
|
17,687
|
2521
|
95.2
|
25.4
|
27.3
|
31.0
|
16.2
|
47.2
|
|
Economic Disadvantage Status
|
325,867
|
2488
|
100.2
|
38.3
|
27.0
|
24.4
|
10.2
|
34.6
|
Table 8.31: GRADE 7 ELA/LITERACY AVERAGE OVERALL SCALE SCORE AND PERCENTAGE IN EACH ACHIEVEMENT LEVEL BY SELECTED DEMOGRAPHIC GROUPS , 2023-24 ADMINISTRATION
|
Group
|
Scale Scores
N
|
Scale Scores
Mean
|
Scale Scores
SD
|
Achievement
Levels(%) 1
|
Achievement
Levels(%) 2
|
Achievement
Levels(%) 3
|
Achievement
Levels(%) 4
|
Achievement
Levels(%)3&4
|
|
Total
|
585,493
|
2537
|
112.8
|
30.0
|
22.1
|
30.6
|
17.2
|
47.8
|
|
Female
|
266,922
|
2551
|
109.5
|
25.4
|
21.9
|
32.7
|
20.1
|
52.8
|
|
Male
|
300,205
|
2524
|
114.5
|
34.3
|
22.3
|
28.7
|
14.7
|
43.4
|
|
American Indian or Alaska Native
|
6,311
|
2496
|
105.7
|
43.4
|
25.1
|
24.3
|
7.2
|
31.6
|
|
Asian
|
53,659
|
2609
|
105.0
|
11.9
|
13.3
|
33.9
|
40.9
|
74.9
|
|
Black/African American
|
31,644
|
2490
|
108.6
|
46.0
|
23.7
|
22.8
|
7.4
|
30.2
|
|
Native Hawaiian or Pacific Islander
|
6,747
|
2501
|
105.3
|
41.1
|
25.8
|
24.9
|
8.2
|
33.0
|
|
Hispanic/Latino Ethnicity
|
276,103
|
2507
|
107.4
|
39.0
|
25.1
|
26.7
|
9.3
|
36.0
|
|
White
|
174,347
|
2558
|
106.1
|
22.3
|
21.2
|
35.7
|
20.8
|
56.5
|
|
Two or More Races
|
30,663
|
2565
|
110.1
|
21.6
|
19.3
|
34.5
|
24.6
|
59.1
|
|
Unidentified Race
|
47,295
|
2547
|
114.4
|
27.9
|
20.4
|
30.9
|
20.8
|
51.7
|
|
EL Status
|
79,642
|
2430
|
86.8
|
70.2
|
21.8
|
7.4
|
0.6
|
8.0
|
|
IDEA Indicator
|
73,396
|
2436
|
100.6
|
67.9
|
18.6
|
10.6
|
2.9
|
13.5
|
|
Section 504 Status
|
19,462
|
2545
|
102.7
|
25.4
|
24.6
|
34.0
|
16.0
|
50.0
|
|
Economic Disadvantage Status
|
327,263
|
2507
|
108.3
|
39.2
|
24.7
|
26.5
|
9.5
|
36.1
|
Table 8.32: GRADE 8 ELA/LITERACY AVERAGE OVERALL SCALE SCORE AND PERCENTAGE IN EACH ACHIEVEMENT LEVEL BY SELECTED DEMOGRAPHIC GROUPS , 2023-24 ADMINISTRATION
|
Group
|
Scale Scores
N
|
Scale Scores
Mean
|
Scale Scores
SD
|
Achievement
Levels(%) 1
|
Achievement
Levels(%) 2
|
Achievement
Levels(%) 3
|
Achievement
Levels(%) 4
|
Achievement
Levels(%)3&4
|
|
Total
|
585,736
|
2549
|
114.0
|
29.3
|
24.3
|
30.6
|
15.8
|
46.3
|
|
Female
|
266,664
|
2564
|
110.4
|
24.1
|
24.2
|
33.0
|
18.7
|
51.7
|
|
Male
|
300,897
|
2535
|
115.6
|
34.0
|
24.4
|
28.2
|
13.3
|
41.5
|
|
American Indian or Alaska Native
|
6,205
|
2503
|
106.3
|
44.1
|
27.0
|
22.7
|
6.3
|
28.9
|
|
Asian
|
52,108
|
2621
|
106.7
|
11.9
|
14.5
|
35.8
|
37.8
|
73.6
|
|
Black/African American
|
30,616
|
2502
|
110.0
|
44.9
|
25.7
|
22.4
|
7.0
|
29.4
|
|
Native Hawaiian or Pacific Islander
|
6,629
|
2512
|
105.0
|
41.0
|
28.3
|
23.5
|
7.3
|
30.7
|
|
Hispanic/Latino Ethnicity
|
271,511
|
2519
|
108.3
|
37.9
|
27.4
|
26.2
|
8.5
|
34.7
|
|
White
|
165,425
|
2566
|
109.0
|
23.2
|
23.6
|
34.9
|
18.4
|
53.2
|
|
Two or More Races
|
28,072
|
2576
|
112.1
|
21.2
|
21.9
|
34.3
|
22.5
|
56.8
|
|
Unidentified Race
|
65,848
|
2566
|
112.9
|
24.3
|
22.1
|
33.6
|
19.9
|
53.5
|
|
EL Status
|
68,876
|
2435
|
85.5
|
72.0
|
21.8
|
5.7
|
0.5
|
6.2
|
|
IDEA Indicator
|
70,650
|
2446
|
98.2
|
68.0
|
20.2
|
9.6
|
2.2
|
11.8
|
|
Section 504 Status
|
20,808
|
2557
|
104.6
|
24.8
|
26.5
|
33.6
|
15.1
|
48.6
|
|
Economic Disadvantage Status
|
326,763
|
2520
|
109.3
|
37.9
|
27.0
|
26.3
|
8.9
|
35.2
|
Table 8.33: HIGH SCHOOL ELA/LITERACY AVERAGE OVERALL SCALE SCORE AND PERCENTAGE IN EACH ACHIEVEMENT LEVEL BY SELECTED DEMOGRAPHIC GROUPS , 2023-24 ADMINISTRATION
|
Group
|
Scale Scores
N
|
Scale Scores
Mean
|
Scale Scores
SD
|
Achievement
Levels(%) 1
|
Achievement
Levels(%) 2
|
Achievement
Levels(%) 3
|
Achievement
Levels(%) 4
|
Achievement
Levels(%)3&4
|
|
Total
|
590,020
|
2589
|
124.5
|
23.0
|
21.1
|
30.0
|
25.9
|
55.9
|
|
Female
|
271,059
|
2607
|
117.6
|
17.7
|
20.6
|
32.2
|
29.5
|
61.7
|
|
Male
|
303,414
|
2574
|
128.6
|
27.8
|
21.4
|
27.9
|
22.8
|
50.8
|
|
American Indian or Alaska Native
|
5,509
|
2546
|
117.4
|
33.2
|
26.4
|
27.4
|
13.0
|
40.4
|
|
Asian
|
49,679
|
2658
|
113.9
|
10.0
|
12.1
|
28.1
|
49.8
|
77.9
|
|
Black/African American
|
23,879
|
2536
|
123.1
|
37.6
|
24.7
|
24.6
|
13.2
|
37.8
|
|
Native Hawaiian or Pacific Islander
|
5,090
|
2553
|
113.3
|
30.9
|
27.6
|
28.2
|
13.3
|
41.5
|
|
Hispanic/Latino Ethnicity
|
262,828
|
2562
|
121.2
|
29.1
|
24.3
|
29.2
|
17.3
|
46.6
|
|
White
|
136,654
|
2609
|
122.2
|
18.5
|
18.8
|
31.0
|
31.6
|
62.6
|
|
Two or More Races
|
22,292
|
2619
|
123.0
|
17.0
|
17.4
|
29.8
|
35.8
|
65.6
|
|
Unidentified Race
|
113,397
|
2597
|
119.9
|
20.2
|
21.0
|
31.7
|
27.1
|
58.7
|
|
EL Status
|
62,191
|
2451
|
92.8
|
67.0
|
24.1
|
8.0
|
0.8
|
8.8
|
|
IDEA Indicator
|
65,082
|
2475
|
107.6
|
59.0
|
24.2
|
12.9
|
3.9
|
16.8
|
|
Section 504 Status
|
26,860
|
2605
|
116.4
|
17.5
|
21.5
|
32.9
|
28.0
|
61.0
|
|
Economic Disadvantage Status
|
329,559
|
2561
|
121.7
|
29.5
|
24.4
|
28.8
|
17.3
|
46.2
|
Table 8.34: GRADE 3 MATHEMATICS AVERAGE OVERALL SCALE SCORE AND PERCENTAGE IN EACH ACHIEVEMENT LEVEL BY SELECTED DEMOGRAPHIC GROUPS , 2023-24 ADMINISTRATION
|
Group
|
Scale Scores
N
|
Scale Scores
Mean
|
Scale Scores
SD
|
Achievement
Levels(%) 1
|
Achievement
Levels(%) 2
|
Achievement
Levels(%) 3
|
Achievement
Levels(%) 4
|
Achievement
Levels(%)3&4
|
|
Total
|
567,862
|
2424
|
93.1
|
31.9
|
21.8
|
25.1
|
21.2
|
46.3
|
|
Female
|
260,111
|
2420
|
90.7
|
33.2
|
22.6
|
25.0
|
19.2
|
44.2
|
|
Male
|
289,235
|
2429
|
95.1
|
30.2
|
21.0
|
25.4
|
23.4
|
48.8
|
|
American Indian or Alaska Native
|
5,751
|
2384
|
88.3
|
49.0
|
22.4
|
19.1
|
9.5
|
28.6
|
|
Asian
|
56,882
|
2485
|
89.8
|
13.0
|
14.0
|
26.2
|
46.8
|
73.0
|
|
Black/African American
|
29,284
|
2382
|
89.4
|
48.6
|
23.2
|
18.9
|
9.3
|
28.2
|
|
Native Hawaiian or Pacific Islander
|
6,776
|
2392
|
86.2
|
44.4
|
24.4
|
20.7
|
10.4
|
31.2
|
|
Hispanic/Latino Ethnicity
|
265,058
|
2398
|
86.3
|
41.8
|
24.3
|
22.3
|
11.6
|
33.9
|
|
White
|
177,632
|
2442
|
88.7
|
23.4
|
21.1
|
29.2
|
26.3
|
55.5
|
|
Two or More Races
|
35,585
|
2449
|
92.4
|
22.3
|
19.6
|
27.4
|
30.6
|
58.1
|
|
Unidentified Race
|
32,372
|
2409
|
94.4
|
38.1
|
21.4
|
23.2
|
17.4
|
40.5
|
|
EL Status
|
122,309
|
2373
|
81.7
|
54.2
|
23.8
|
16.1
|
5.9
|
22.0
|
|
IDEA Indicator
|
78,322
|
2362
|
97.1
|
59.1
|
17.8
|
14.1
|
8.9
|
23.0
|
|
Section 504 Status
|
10,801
|
2431
|
88.3
|
28.3
|
22.6
|
27.2
|
21.8
|
49.1
|
|
Economic Disadvantage Status
|
314,132
|
2399
|
87.7
|
41.4
|
24.1
|
22.2
|
12.3
|
34.5
|
Table 8.35: GRADE 4 MATHEMATICS AVERAGE OVERALL SCALE SCORE AND PERCENTAGE IN EACH ACHIEVEMENT LEVEL BY SELECTED DEMOGRAPHIC GROUPS , 2023-24 ADMINISTRATION
|
Group
|
Scale Scores
N
|
Scale Scores
Mean
|
Scale Scores
SD
|
Achievement
Levels(%) 1
|
Achievement
Levels(%) 2
|
Achievement
Levels(%) 3
|
Achievement
Levels(%) 4
|
Achievement
Levels(%)3&4
|
|
Total
|
582,267
|
2463
|
95.3
|
29.6
|
28.1
|
22.7
|
19.6
|
42.3
|
|
Female
|
265,746
|
2459
|
91.9
|
30.9
|
29.4
|
22.5
|
17.2
|
39.7
|
|
Male
|
297,391
|
2468
|
98.1
|
28.2
|
26.8
|
22.9
|
22.1
|
45.1
|
|
American Indian or Alaska Native
|
6,378
|
2424
|
89.2
|
45.0
|
29.9
|
16.9
|
8.2
|
25.0
|
|
Asian
|
57,247
|
2530
|
92.1
|
11.2
|
17.6
|
24.6
|
46.6
|
71.2
|
|
Black/African American
|
30,662
|
2418
|
89.8
|
47.1
|
29.5
|
16.0
|
7.4
|
23.4
|
|
Native Hawaiian or Pacific Islander
|
7,115
|
2432
|
87.8
|
40.2
|
32.0
|
18.5
|
9.3
|
27.8
|
|
Hispanic/Latino Ethnicity
|
270,765
|
2435
|
87.1
|
39.4
|
31.6
|
19.1
|
9.9
|
29.0
|
|
White
|
183,869
|
2484
|
90.3
|
20.9
|
26.9
|
27.4
|
24.9
|
52.3
|
|
Two or More Races
|
35,452
|
2489
|
94.4
|
20.4
|
25.0
|
26.1
|
28.4
|
54.6
|
|
Unidentified Race
|
33,190
|
2450
|
96.4
|
34.7
|
28.0
|
21.0
|
16.2
|
37.3
|
|
EL Status
|
117,500
|
2405
|
81.0
|
53.8
|
30.3
|
11.8
|
4.1
|
15.9
|
|
IDEA Indicator
|
82,452
|
2395
|
96.5
|
59.5
|
22.2
|
11.1
|
7.2
|
18.3
|
|
Section 504 Status
|
13,573
|
2475
|
87.8
|
23.5
|
29.5
|
25.8
|
21.1
|
47.0
|
|
Economic Disadvantage Status
|
322,356
|
2436
|
88.8
|
38.9
|
31.1
|
19.4
|
10.6
|
30.0
|
Table 8.36: GRADE 5 MATHEMATICS AVERAGE OVERALL SCALE SCORE AND PERCENTAGE IN EACH ACHIEVEMENT LEVEL BY SELECTED DEMOGRAPHIC GROUPS , 2023-24 ADMINISTRATION
|
Group
|
Scale Scores
N
|
Scale Scores
Mean
|
Scale Scores
SD
|
Achievement
Levels(%) 1
|
Achievement
Levels(%) 2
|
Achievement
Levels(%) 3
|
Achievement
Levels(%) 4
|
Achievement
Levels(%)3&4
|
|
Total
|
588,105
|
2486
|
104.5
|
39.1
|
24.7
|
15.7
|
20.4
|
36.2
|
|
Female
|
268,926
|
2482
|
101.3
|
40.3
|
25.8
|
15.4
|
18.5
|
33.9
|
|
Male
|
300,124
|
2490
|
107.5
|
37.7
|
23.7
|
16.2
|
22.5
|
38.7
|
|
American Indian or Alaska Native
|
6,490
|
2442
|
97.0
|
56.2
|
24.5
|
10.7
|
8.6
|
19.3
|
|
Asian
|
59,441
|
2561
|
99.9
|
15.4
|
17.4
|
18.2
|
49.0
|
67.2
|
|
Black/African American
|
31,578
|
2435
|
98.0
|
58.4
|
23.3
|
10.4
|
7.9
|
18.3
|
|
Native Hawaiian or Pacific Islander
|
7,110
|
2455
|
94.3
|
51.0
|
25.9
|
13.3
|
9.8
|
23.2
|
|
Hispanic/Latino Ethnicity
|
273,312
|
2454
|
95.0
|
50.8
|
26.2
|
12.8
|
10.2
|
23.0
|
|
White
|
183,561
|
2508
|
99.3
|
29.3
|
25.5
|
19.3
|
25.9
|
45.2
|
|
Two or More Races
|
34,585
|
2515
|
104.0
|
28.4
|
23.1
|
18.8
|
29.6
|
48.4
|
|
Unidentified Race
|
33,987
|
2475
|
104.2
|
43.0
|
24.5
|
15.0
|
17.5
|
32.5
|
|
EL Status
|
103,801
|
2412
|
84.0
|
70.4
|
20.8
|
5.9
|
2.9
|
8.8
|
|
IDEA Indicator
|
80,792
|
2404
|
100.0
|
72.0
|
15.7
|
6.3
|
6.0
|
12.3
|
|
Section 504 Status
|
15,983
|
2498
|
96.7
|
33.6
|
27.1
|
17.6
|
21.7
|
39.2
|
|
Economic Disadvantage Status
|
326,154
|
2456
|
97.1
|
50.1
|
25.8
|
13.0
|
11.1
|
24.0
|
Table 8.37: GRADE 6 MATHEMATICS AVERAGE OVERALL SCALE SCORE AND PERCENTAGE IN EACH ACHIEVEMENT LEVEL BY SELECTED DEMOGRAPHIC GROUPS , 2023-24 ADMINISTRATION
|
Group
|
Scale Scores
N
|
Scale Scores
Mean
|
Scale Scores
SD
|
Achievement
Levels(%) 1
|
Achievement
Levels(%) 2
|
Achievement
Levels(%) 3
|
Achievement
Levels(%) 4
|
Achievement
Levels(%)3&4
|
|
Total
|
585,884
|
2500
|
116.9
|
40.0
|
25.4
|
16.2
|
18.5
|
34.7
|
|
Female
|
267,799
|
2498
|
114.4
|
40.9
|
25.7
|
15.9
|
17.4
|
33.4
|
|
Male
|
299,452
|
2504
|
119.3
|
38.7
|
25.0
|
16.5
|
19.8
|
36.3
|
|
American Indian or Alaska Native
|
6,329
|
2447
|
108.2
|
59.0
|
23.5
|
10.5
|
7.1
|
17.5
|
|
Asian
|
58,273
|
2590
|
112.4
|
15.3
|
17.5
|
18.7
|
48.5
|
67.2
|
|
Black/African American
|
31,377
|
2443
|
108.2
|
60.2
|
23.2
|
10.1
|
6.5
|
16.6
|
|
Native Hawaiian or Pacific Islander
|
7,050
|
2462
|
107.6
|
53.2
|
25.7
|
12.8
|
8.2
|
21.0
|
|
Hispanic/Latino Ethnicity
|
276,213
|
2466
|
106.9
|
51.7
|
26.3
|
13.1
|
9.0
|
22.0
|
|
White
|
180,008
|
2524
|
109.9
|
30.0
|
27.0
|
20.1
|
22.9
|
43.0
|
|
Two or More Races
|
33,103
|
2531
|
114.6
|
29.2
|
25.1
|
19.4
|
26.4
|
45.7
|
|
Unidentified Race
|
35,211
|
2486
|
118.2
|
45.0
|
24.3
|
15.0
|
15.8
|
30.8
|
|
EL Status
|
92,635
|
2408
|
93.1
|
75.8
|
17.8
|
4.5
|
1.9
|
6.4
|
|
IDEA Indicator
|
75,650
|
2401
|
107.8
|
75.6
|
14.7
|
5.5
|
4.2
|
9.7
|
|
Section 504 Status
|
17,722
|
2511
|
105.8
|
34.9
|
29.0
|
18.2
|
18.0
|
36.2
|
|
Economic Disadvantage Status
|
328,577
|
2468
|
109.0
|
51.1
|
26.1
|
13.1
|
9.8
|
22.9
|
Table 8.38: GRADE 7 MATHEMATICS AVERAGE OVERALL SCALE SCORE AND PERCENTAGE IN EACH ACHIEVEMENT LEVEL BY SELECTED DEMOGRAPHIC GROUPS , 2023-24 ADMINISTRATION
|
Group
|
Scale Scores
N
|
Scale Scores
Mean
|
Scale Scores
SD
|
Achievement
Levels(%) 1
|
Achievement
Levels(%) 2
|
Achievement
Levels(%) 3
|
Achievement
Levels(%) 4
|
Achievement
Levels(%)3&4
|
|
Total
|
588,474
|
2515
|
122
|
40.5
|
24.9
|
17.4
|
17.2
|
34.6
|
|
Female
|
268,264
|
2510
|
120
|
42.1
|
25.3
|
16.6
|
16.0
|
32.6
|
|
Male
|
301,906
|
2519
|
124
|
38.7
|
24.5
|
18.1
|
18.7
|
36.7
|
|
American Indian or Alaska Native
|
6,316
|
2468
|
110
|
56.7
|
24.3
|
11.7
|
7.4
|
19.1
|
|
Asian
|
54,313
|
2611
|
120
|
15.5
|
16.8
|
20.3
|
47.4
|
67.7
|
|
Black/African American
|
31,522
|
2456
|
108
|
60.6
|
23.0
|
10.8
|
5.6
|
16.4
|
|
Native Hawaiian or Pacific Islander
|
6,770
|
2468
|
108
|
56.1
|
25.2
|
12.2
|
6.6
|
18.8
|
|
Hispanic/Latino Ethnicity
|
278,217
|
2477
|
109
|
52.6
|
26.0
|
13.7
|
7.7
|
21.4
|
|
White
|
174,446
|
2541
|
114
|
30.0
|
26.5
|
22.2
|
21.3
|
43.5
|
|
Two or More Races
|
30,666
|
2546
|
121
|
30.0
|
24.2
|
20.9
|
24.9
|
45.8
|
|
Unidentified Race
|
48,017
|
2524
|
128
|
38.5
|
22.6
|
17.7
|
21.2
|
38.9
|
|
EL Status
|
84,225
|
2413
|
93
|
78.3
|
15.8
|
4.3
|
1.6
|
5.9
|
|
IDEA Indicator
|
73,004
|
2414
|
106
|
76.2
|
14.6
|
5.6
|
3.5
|
9.2
|
|
Section 504 Status
|
19,461
|
2528
|
111
|
34.6
|
27.9
|
20.2
|
17.3
|
37.5
|
|
Economic Disadvantage Status
|
329,006
|
2479
|
112
|
52.0
|
25.6
|
13.8
|
8.6
|
22.4
|
Table 8.39: GRADE 8 MATHEMATICS AVERAGE OVERALL SCALE SCORE AND PERCENTAGE IN EACH ACHIEVEMENT LEVEL BY SELECTED DEMOGRAPHIC GROUPS , 2023-24 ADMINISTRATION
|
Group
|
Scale Scores
N
|
Scale Scores
Mean
|
Scale Scores
SD
|
Achievement
Levels(%) 1
|
Achievement
Levels(%) 2
|
Achievement
Levels(%) 3
|
Achievement
Levels(%) 4
|
Achievement
Levels(%)3&4
|
|
Total
|
588,081
|
2525
|
131.2
|
45.8
|
22.3
|
14.0
|
18.0
|
31.9
|
|
Female
|
267,772
|
2525
|
128.0
|
45.4
|
23.1
|
14.3
|
17.2
|
31.5
|
|
Male
|
302,265
|
2525
|
134.5
|
45.8
|
21.5
|
13.7
|
19.0
|
32.7
|
|
American Indian or Alaska Native
|
6,190
|
2471
|
115.4
|
63.3
|
20.2
|
9.8
|
6.6
|
16.4
|
|
Asian
|
52,635
|
2630
|
133.7
|
19.0
|
15.8
|
16.6
|
48.6
|
65.2
|
|
Black/African American
|
30,525
|
2461
|
113.3
|
65.8
|
20.1
|
8.3
|
5.7
|
14.0
|
|
Native Hawaiian or Pacific Islander
|
6,645
|
2475
|
113.8
|
61.8
|
21.3
|
9.7
|
7.2
|
16.9
|
|
Hispanic/Latino Ethnicity
|
273,231
|
2484
|
116.0
|
58.3
|
22.7
|
10.7
|
8.4
|
19.0
|
|
White
|
165,360
|
2548
|
124.9
|
36.6
|
24.3
|
17.7
|
21.4
|
39.1
|
|
Two or More Races
|
28,042
|
2557
|
132.7
|
35.9
|
22.3
|
16.5
|
25.4
|
41.9
|
|
Unidentified Race
|
66,488
|
2546
|
132.8
|
39.1
|
21.7
|
16.2
|
23.1
|
39.3
|
|
EL Status
|
72,910
|
2413
|
95.5
|
83.9
|
11.6
|
2.9
|
1.6
|
4.5
|
|
IDEA Indicator
|
70,275
|
2416
|
106.1
|
81.4
|
11.7
|
4.0
|
3.0
|
7.0
|
|
Section 504 Status
|
20,819
|
2535
|
120.1
|
41.2
|
25.3
|
15.9
|
17.6
|
33.5
|
|
Economic Disadvantage Status
|
327,973
|
2487
|
119.1
|
57.4
|
22.3
|
10.9
|
9.4
|
20.3
|
Table 8.40: HIGH SCHOOL MATHEMATICS AVERAGE OVERALL SCALE SCORE AND PERCENTAGE IN EACH ACHIEVEMENT LEVEL BY SELECTED DEMOGRAPHIC GROUPS , 2023-24 ADMINISTRATION
|
Group
|
Scale Scores
N
|
Scale Scores
Mean
|
Scale Scores
SD
|
Achievement
Levels(%) 1
|
Achievement
Levels(%) 2
|
Achievement
Levels(%) 3
|
Achievement
Levels(%) 4
|
Achievement
Levels(%)3&4
|
|
Total
|
597,196
|
2546
|
134.8
|
51.1
|
21.7
|
15.6
|
11.6
|
27.2
|
|
Female
|
275,514
|
2546
|
128.0
|
51.1
|
23.0
|
15.7
|
10.2
|
25.9
|
|
Male
|
306,465
|
2547
|
141.3
|
50.9
|
20.4
|
15.5
|
13.1
|
28.6
|
|
American Indian or Alaska Native
|
5,435
|
2497
|
117.8
|
66.2
|
19.9
|
9.6
|
4.2
|
13.8
|
|
Asian
|
49,689
|
2662
|
138.8
|
20.6
|
17.5
|
23.0
|
38.9
|
62.0
|
|
Black/African American
|
23,599
|
2485
|
117.2
|
70.2
|
17.7
|
8.8
|
3.3
|
12.1
|
|
Native Hawaiian or Pacific Islander
|
5,063
|
2503
|
114.6
|
65.1
|
21.2
|
9.5
|
4.2
|
13.7
|
|
Hispanic/Latino Ethnicity
|
262,473
|
2508
|
118.7
|
62.7
|
21.0
|
11.6
|
4.7
|
16.3
|
|
White
|
136,002
|
2574
|
133.9
|
40.9
|
23.8
|
20.1
|
15.2
|
35.3
|
|
Two or More Races
|
22,212
|
2584
|
140.5
|
39.5
|
21.9
|
19.8
|
18.8
|
38.6
|
|
Unidentified Race
|
121,636
|
2546
|
129.2
|
50.9
|
22.9
|
15.7
|
10.6
|
26.3
|
|
EL Status
|
64,229
|
2433
|
96.8
|
88.1
|
8.5
|
2.6
|
0.8
|
3.4
|
|
IDEA Indicator
|
64,664
|
2432
|
103.0
|
87.0
|
8.7
|
3.0
|
1.3
|
4.4
|
|
Section 504 Status
|
27,251
|
2557
|
127.2
|
47.3
|
24.5
|
16.7
|
11.5
|
28.2
|
|
Economic Disadvantage Status
|
331,906
|
2510
|
121.7
|
62.3
|
20.7
|
11.5
|
5.5
|
17.0
|
Percentile Tables for Overall Scale Scores
Table 8.41 through Table 8.47 present the overall ELA/literacy scale score for the 10th, 20th, 30th, 40th, 50th, 60th, 70th, 80th, and 90th percentiles for grades 3-8 and high school.
Table 8.48 through Table 8.54 present scores for these same percentiles for the overall mathematics scale scores for grades 3-8 and high school. These results are presented at the aggregate level and disaggregated by gender, race/ethnicity, and various status flags: limited English proficiency, IDEA indicator, Section 504, and economically disadvantaged.
Table 8.41: GRADE 3 ELA/LITERACY SCALE SCORE BY SELECTED DEMOGRAPHIC GROUPS, 2023-24 PERCENTILES
|
Group
|
P(%)10
|
P(%)20
|
P(%)30
|
P(%)40
|
P(%)50
|
P(%)60
|
P(%)70
|
P(%)80
|
P(%)90
|
|
Total
|
2278
|
2321
|
2355
|
2385
|
2414
|
2442
|
2470
|
2502
|
2544
|
|
Female
|
2285
|
2331
|
2365
|
2395
|
2423
|
2450
|
2478
|
2509
|
2551
|
|
Male
|
2271
|
2313
|
2347
|
2377
|
2405
|
2433
|
2462
|
2495
|
2538
|
|
American Indian or Alaska Native
|
2255
|
2289
|
2318
|
2343
|
2369
|
2395
|
2423
|
2456
|
2498
|
|
Asian
|
2328
|
2383
|
2421
|
2451
|
2477
|
2503
|
2528
|
2556
|
2596
|
|
Black/African American
|
2254
|
2290
|
2319
|
2346
|
2372
|
2399
|
2428
|
2461
|
2504
|
|
Native Hawaiian or Pacific Islander
|
2260
|
2296
|
2325
|
2353
|
2378
|
2403
|
2431
|
2460
|
2500
|
|
Hispanic/Latino Ethnicity
|
2262
|
2300
|
2330
|
2357
|
2383
|
2409
|
2437
|
2468
|
2509
|
|
White
|
2300
|
2347
|
2382
|
2412
|
2438
|
2462
|
2488
|
2517
|
2556
|
|
Two or More Races
|
2303
|
2352
|
2388
|
2419
|
2447
|
2473
|
2499
|
2530
|
2571
|
|
Unidentified Race
|
2270
|
2311
|
2344
|
2375
|
2403
|
2431
|
2460
|
2493
|
2535
|
|
EL Status
|
2242
|
2275
|
2300
|
2323
|
2345
|
2367
|
2391
|
2419
|
2457
|
|
IDEA Indicator
|
2234
|
2266
|
2291
|
2313
|
2337
|
2363
|
2392
|
2429
|
2480
|
|
Section 504 Status
|
2293
|
2335
|
2366
|
2395
|
2421
|
2446
|
2474
|
2503
|
2542
|
|
Economic Disadvantage Status
|
2261
|
2300
|
2330
|
2358
|
2384
|
2410
|
2438
|
2469
|
2510
|
Table 8.42: GRADE 4 ELA/LITERACY SCALE SCORE BY SELECTED DEMOGRAPHIC GROUPS, 2023-24 PERCENTILES
|
Group
|
P(%)10
|
P(%)20
|
P(%)30
|
P(%)40
|
P(%)50
|
P(%)60
|
P(%)70
|
P(%)80
|
P(%)90
|
|
Total
|
2312
|
2359
|
2396
|
2428
|
2458
|
2486
|
2516
|
2548
|
2593
|
|
Female
|
2321
|
2369
|
2406
|
2437
|
2466
|
2494
|
2523
|
2555
|
2599
|
|
Male
|
2305
|
2350
|
2387
|
2419
|
2450
|
2479
|
2509
|
2542
|
2587
|
|
American Indian or Alaska Native
|
2286
|
2330
|
2360
|
2387
|
2414
|
2440
|
2467
|
2501
|
2544
|
|
Asian
|
2369
|
2430
|
2470
|
2501
|
2528
|
2553
|
2579
|
2608
|
2647
|
|
Black/African American
|
2284
|
2322
|
2353
|
2381
|
2409
|
2438
|
2467
|
2502
|
2547
|
|
Native Hawaiian or Pacific Islander
|
2294
|
2332
|
2363
|
2393
|
2419
|
2448
|
2476
|
2508
|
2554
|
|
Hispanic/Latino Ethnicity
|
2295
|
2337
|
2369
|
2398
|
2426
|
2452
|
2481
|
2512
|
2555
|
|
White
|
2338
|
2388
|
2425
|
2456
|
2482
|
2508
|
2535
|
2564
|
2604
|
|
Two or More Races
|
2340
|
2393
|
2432
|
2463
|
2491
|
2518
|
2546
|
2577
|
2618
|
|
Unidentified Race
|
2306
|
2351
|
2386
|
2420
|
2449
|
2479
|
2509
|
2542
|
2587
|
|
EL Status
|
2270
|
2306
|
2333
|
2356
|
2378
|
2401
|
2426
|
2454
|
2491
|
|
IDEA Indicator
|
2257
|
2293
|
2319
|
2342
|
2367
|
2394
|
2424
|
2462
|
2516
|
|
Section 504 Status
|
2336
|
2380
|
2413
|
2441
|
2467
|
2493
|
2520
|
2550
|
2591
|
|
Economic Disadvantage Status
|
2295
|
2337
|
2369
|
2399
|
2426
|
2453
|
2482
|
2514
|
2557
|
Table 8.43: GRADE 5 ELA/LITERACY SCALE SCORE BY SELECTED DEMOGRAPHIC GROUPS, 2023-24 PERCENTILES
|
Group
|
P(%)10
|
P(%)20
|
P(%)30
|
P(%)40
|
P(%)50
|
P(%)60
|
P(%)70
|
P(%)80
|
P(%)90
|
|
Total
|
2345
|
2396
|
2434
|
2467
|
2497
|
2527
|
2557
|
2591
|
2636
|
|
Female
|
2358
|
2409
|
2447
|
2478
|
2507
|
2536
|
2566
|
2600
|
2644
|
|
Male
|
2334
|
2384
|
2423
|
2456
|
2487
|
2518
|
2549
|
2583
|
2628
|
|
American Indian or Alaska Native
|
2320
|
2361
|
2394
|
2422
|
2450
|
2478
|
2508
|
2540
|
2585
|
|
Asian
|
2410
|
2473
|
2515
|
2546
|
2574
|
2598
|
2624
|
2653
|
2691
|
|
Black/African American
|
2313
|
2354
|
2388
|
2418
|
2447
|
2477
|
2507
|
2542
|
2589
|
|
Native Hawaiian or Pacific Islander
|
2327
|
2371
|
2405
|
2435
|
2461
|
2489
|
2516
|
2549
|
2592
|
|
Hispanic/Latino Ethnicity
|
2327
|
2372
|
2407
|
2436
|
2464
|
2491
|
2520
|
2553
|
2597
|
|
White
|
2373
|
2426
|
2464
|
2495
|
2523
|
2550
|
2578
|
2607
|
2647
|
|
Two or More Races
|
2374
|
2431
|
2471
|
2503
|
2533
|
2561
|
2589
|
2620
|
2660
|
|
Unidentified Race
|
2340
|
2389
|
2427
|
2459
|
2490
|
2520
|
2549
|
2584
|
2628
|
|
EL Status
|
2293
|
2330
|
2358
|
2382
|
2404
|
2426
|
2449
|
2475
|
2512
|
|
IDEA Indicator
|
2282
|
2318
|
2344
|
2369
|
2393
|
2420
|
2450
|
2487
|
2544
|
|
Section 504 Status
|
2372
|
2419
|
2453
|
2482
|
2509
|
2534
|
2562
|
2593
|
2635
|
|
Economic Disadvantage Status
|
2326
|
2372
|
2407
|
2437
|
2465
|
2493
|
2522
|
2555
|
2599
|
Table 8.44: GRADE 6 ELA/LITERACY SCALE SCORE BY SELECTED DEMOGRAPHIC GROUPS, 2023-24 PERCENTILES
|
Group
|
P(%)10
|
P(%)20
|
P(%)30
|
P(%)40
|
P(%)50
|
P(%)60
|
P(%)70
|
P(%)80
|
P(%)90
|
|
Total
|
2373
|
2421
|
2458
|
2490
|
2519
|
2548
|
2577
|
2610
|
2651
|
|
Female
|
2389
|
2437
|
2473
|
2504
|
2533
|
2561
|
2589
|
2621
|
2661
|
|
Male
|
2361
|
2408
|
2444
|
2476
|
2506
|
2536
|
2566
|
2599
|
2641
|
|
American Indian or Alaska Native
|
2345
|
2383
|
2413
|
2441
|
2469
|
2495
|
2525
|
2557
|
2600
|
|
Asian
|
2440
|
2502
|
2541
|
2571
|
2597
|
2620
|
2643
|
2668
|
2703
|
|
Black/African American
|
2342
|
2381
|
2412
|
2440
|
2469
|
2497
|
2526
|
2561
|
2607
|
|
Native Hawaiian or Pacific Islander
|
2354
|
2396
|
2428
|
2456
|
2482
|
2510
|
2539
|
2572
|
2614
|
|
Hispanic/Latino Ethnicity
|
2357
|
2400
|
2433
|
2462
|
2489
|
2516
|
2544
|
2576
|
2617
|
|
White
|
2397
|
2447
|
2483
|
2514
|
2542
|
2568
|
2594
|
2623
|
2660
|
|
Two or More Races
|
2400
|
2453
|
2491
|
2523
|
2551
|
2578
|
2605
|
2634
|
2672
|
|
Unidentified Race
|
2363
|
2410
|
2447
|
2480
|
2510
|
2540
|
2571
|
2603
|
2645
|
|
EL Status
|
2319
|
2352
|
2377
|
2399
|
2420
|
2441
|
2462
|
2488
|
2523
|
|
IDEA Indicator
|
2311
|
2344
|
2368
|
2390
|
2412
|
2436
|
2463
|
2497
|
2549
|
|
Section 504 Status
|
2396
|
2438
|
2471
|
2499
|
2524
|
2549
|
2575
|
2605
|
2644
|
|
Economic Disadvantage Status
|
2356
|
2399
|
2432
|
2461
|
2488
|
2516
|
2544
|
2576
|
2618
|
Table 8.45: GRADE 7 ELA/LITERACY SCALE SCORE BY SELECTED DEMOGRAPHIC GROUPS, 2023-24 PERCENTILES
|
Group
|
P(%)10
|
P(%)20
|
P(%)30
|
P(%)40
|
P(%)50
|
P(%)60
|
P(%)70
|
P(%)80
|
P(%)90
|
|
Total
|
2380
|
2436
|
2478
|
2513
|
2545
|
2575
|
2605
|
2638
|
2681
|
|
Female
|
2399
|
2455
|
2496
|
2529
|
2560
|
2588
|
2617
|
2649
|
2690
|
|
Male
|
2366
|
2420
|
2462
|
2498
|
2531
|
2562
|
2593
|
2627
|
2671
|
|
American Indian or Alaska Native
|
2355
|
2402
|
2440
|
2469
|
2498
|
2526
|
2556
|
2590
|
2633
|
|
Asian
|
2462
|
2529
|
2570
|
2601
|
2627
|
2651
|
2675
|
2702
|
2738
|
|
Black/African American
|
2346
|
2391
|
2428
|
2460
|
2490
|
2521
|
2552
|
2587
|
2633
|
|
Native Hawaiian or Pacific Islander
|
2358
|
2405
|
2443
|
2475
|
2504
|
2533
|
2560
|
2594
|
2639
|
|
Hispanic/Latino Ethnicity
|
2361
|
2411
|
2449
|
2482
|
2511
|
2540
|
2569
|
2602
|
2644
|
|
White
|
2409
|
2468
|
2508
|
2541
|
2569
|
2596
|
2622
|
2651
|
2689
|
|
Two or More Races
|
2409
|
2471
|
2513
|
2549
|
2578
|
2605
|
2633
|
2663
|
2703
|
|
Unidentified Race
|
2387
|
2444
|
2487
|
2524
|
2557
|
2588
|
2619
|
2652
|
2693
|
|
EL Status
|
2314
|
2353
|
2381
|
2406
|
2430
|
2453
|
2478
|
2505
|
2541
|
|
IDEA Indicator
|
2310
|
2349
|
2377
|
2402
|
2428
|
2455
|
2485
|
2521
|
2572
|
|
Section 504 Status
|
2406
|
2457
|
2494
|
2524
|
2551
|
2578
|
2605
|
2635
|
2675
|
|
Economic Disadvantage Status
|
2360
|
2410
|
2448
|
2481
|
2511
|
2540
|
2570
|
2603
|
2646
|
Table 8.46: GRADE 8 ELA/LITERACY SCALE SCORE BY SELECTED DEMOGRAPHIC GROUPS, 2023-24 PERCENTILES
|
Group
|
P(%)10
|
P(%)20
|
P(%)30
|
P(%)40
|
P(%)50
|
P(%)60
|
P(%)70
|
P(%)80
|
P(%)90
|
|
Total
|
2391
|
2448
|
2489
|
2524
|
2555
|
2586
|
2617
|
2651
|
2695
|
|
Female
|
2413
|
2469
|
2508
|
2541
|
2571
|
2600
|
2630
|
2663
|
2705
|
|
Male
|
2375
|
2430
|
2472
|
2507
|
2539
|
2572
|
2604
|
2639
|
2684
|
|
American Indian or Alaska Native
|
2361
|
2408
|
2445
|
2476
|
2503
|
2532
|
2562
|
2599
|
2643
|
|
Asian
|
2470
|
2538
|
2580
|
2612
|
2638
|
2662
|
2687
|
2714
|
2751
|
|
Black/African American
|
2353
|
2403
|
2440
|
2472
|
2502
|
2532
|
2564
|
2600
|
2648
|
|
Native Hawaiian or Pacific Islander
|
2373
|
2420
|
2454
|
2484
|
2511
|
2538
|
2569
|
2604
|
2650
|
|
Hispanic/Latino Ethnicity
|
2372
|
2423
|
2461
|
2493
|
2522
|
2551
|
2581
|
2615
|
2659
|
|
White
|
2414
|
2473
|
2513
|
2546
|
2576
|
2603
|
2631
|
2662
|
2702
|
|
Two or More Races
|
2418
|
2481
|
2523
|
2556
|
2588
|
2616
|
2645
|
2675
|
2716
|
|
Unidentified Race
|
2406
|
2467
|
2510
|
2545
|
2578
|
2607
|
2636
|
2667
|
2707
|
|
EL Status
|
2314
|
2357
|
2387
|
2411
|
2434
|
2457
|
2481
|
2508
|
2544
|
|
IDEA Indicator
|
2316
|
2358
|
2388
|
2413
|
2438
|
2464
|
2493
|
2527
|
2578
|
|
Section 504 Status
|
2417
|
2467
|
2505
|
2534
|
2563
|
2590
|
2617
|
2649
|
2691
|
|
Economic Disadvantage Status
|
2371
|
2422
|
2461
|
2493
|
2523
|
2552
|
2582
|
2617
|
2661
|
Table 8.47: HIGH SCHOOL ELA/LITERACY SCALE SCORE BY SELECTED DEMOGRAPHIC GROUPS, 2023-24 PERCENTILES
|
Group
|
P(%)10
|
P(%)20
|
P(%)30
|
P(%)40
|
P(%)50
|
P(%)60
|
P(%)70
|
P(%)80
|
P(%)90
|
|
Total
|
2410
|
2476
|
2526
|
2567
|
2603
|
2635
|
2668
|
2703
|
2747
|
|
Female
|
2440
|
2505
|
2551
|
2588
|
2620
|
2650
|
2680
|
2713
|
2755
|
|
Male
|
2390
|
2452
|
2503
|
2546
|
2585
|
2621
|
2655
|
2693
|
2739
|
|
American Indian or Alaska Native
|
2382
|
2438
|
2479
|
2518
|
2553
|
2583
|
2616
|
2651
|
2697
|
|
Asian
|
2492
|
2571
|
2618
|
2652
|
2681
|
2708
|
2733
|
2761
|
2795
|
|
Black/African American
|
2369
|
2421
|
2464
|
2501
|
2538
|
2574
|
2610
|
2651
|
2699
|
|
Native Hawaiian or Pacific Islander
|
2400
|
2450
|
2490
|
2524
|
2556
|
2588
|
2621
|
2653
|
2701
|
|
Hispanic/Latino Ethnicity
|
2390
|
2449
|
2496
|
2536
|
2571
|
2604
|
2636
|
2671
|
2716
|
|
White
|
2430
|
2502
|
2552
|
2592
|
2626
|
2656
|
2686
|
2719
|
2760
|
|
Two or More Races
|
2440
|
2510
|
2563
|
2604
|
2637
|
2669
|
2699
|
2731
|
2773
|
|
Unidentified Race
|
2425
|
2491
|
2539
|
2578
|
2611
|
2642
|
2673
|
2705
|
2746
|
|
EL Status
|
2325
|
2366
|
2396
|
2422
|
2447
|
2473
|
2501
|
2533
|
2576
|
|
IDEA Indicator
|
2335
|
2378
|
2409
|
2438
|
2466
|
2495
|
2528
|
2567
|
2621
|
|
Section 504 Status
|
2440
|
2505
|
2550
|
2586
|
2617
|
2646
|
2676
|
2709
|
2750
|
|
Economic Disadvantage Status
|
2389
|
2448
|
2495
|
2534
|
2570
|
2602
|
2635
|
2671
|
2716
|
Table 8.48: GRADE 3 MATHEMATICS SCALE SCORE BY SELECTED DEMOGRAPHIC GROUPS, 2023-24 PERCENTILES
|
Group
|
P(%)10
|
P(%)20
|
P(%)30
|
P(%)40
|
P(%)50
|
P(%)60
|
P(%)70
|
P(%)80
|
P(%)90
|
|
Total
|
2301
|
2344
|
2375
|
2402
|
2427
|
2451
|
2476
|
2504
|
2543
|
|
Female
|
2301
|
2342
|
2372
|
2398
|
2422
|
2445
|
2470
|
2498
|
2536
|
|
Male
|
2302
|
2347
|
2380
|
2408
|
2433
|
2457
|
2482
|
2511
|
2550
|
|
American Indian or Alaska Native
|
2268
|
2309
|
2337
|
2360
|
2383
|
2405
|
2432
|
2460
|
2498
|
|
Asian
|
2363
|
2412
|
2444
|
2470
|
2493
|
2515
|
2538
|
2565
|
2603
|
|
Black/African American
|
2263
|
2307
|
2335
|
2360
|
2384
|
2407
|
2431
|
2459
|
2497
|
|
Native Hawaiian or Pacific Islander
|
2281
|
2320
|
2347
|
2370
|
2393
|
2414
|
2439
|
2465
|
2502
|
|
Hispanic/Latino Ethnicity
|
2285
|
2325
|
2352
|
2376
|
2399
|
2422
|
2445
|
2471
|
2508
|
|
White
|
2323
|
2369
|
2400
|
2425
|
2448
|
2469
|
2491
|
2517
|
2552
|
|
Two or More Races
|
2325
|
2372
|
2404
|
2431
|
2455
|
2478
|
2502
|
2528
|
2566
|
|
Unidentified Race
|
2284
|
2327
|
2358
|
2386
|
2411
|
2437
|
2462
|
2492
|
2529
|
|
EL Status
|
2267
|
2305
|
2330
|
2352
|
2372
|
2393
|
2415
|
2441
|
2477
|
|
IDEA Indicator
|
2235
|
2276
|
2306
|
2332
|
2357
|
2383
|
2412
|
2447
|
2494
|
|
Section 504 Status
|
2317
|
2356
|
2385
|
2410
|
2433
|
2456
|
2479
|
2506
|
2544
|
|
Economic Disadvantage Status
|
2284
|
2325
|
2353
|
2377
|
2400
|
2423
|
2446
|
2474
|
2511
|
Table 8.49: GRADE 4 MATHEMATICS SCALE SCORE BY SELECTED DEMOGRAPHIC GROUPS, 2023-24 PERCENTILES
|
Group
|
P(%)10
|
P(%)20
|
P(%)30
|
P(%)40
|
P(%)50
|
P(%)60
|
P(%)70
|
P(%)80
|
P(%)90
|
|
Total
|
2340
|
2381
|
2412
|
2439
|
2465
|
2491
|
2517
|
2547
|
2587
|
|
Female
|
2341
|
2379
|
2408
|
2434
|
2459
|
2484
|
2510
|
2539
|
2579
|
|
Male
|
2339
|
2383
|
2416
|
2445
|
2472
|
2498
|
2525
|
2555
|
2595
|
|
American Indian or Alaska Native
|
2311
|
2348
|
2376
|
2400
|
2422
|
2445
|
2471
|
2501
|
2539
|
|
Asian
|
2403
|
2453
|
2488
|
2516
|
2541
|
2564
|
2587
|
2614
|
2653
|
|
Black/African American
|
2303
|
2343
|
2370
|
2394
|
2417
|
2441
|
2467
|
2495
|
2534
|
|
Native Hawaiian or Pacific Islander
|
2322
|
2359
|
2386
|
2410
|
2432
|
2454
|
2479
|
2507
|
2545
|
|
Hispanic/Latino Ethnicity
|
2324
|
2361
|
2388
|
2412
|
2435
|
2458
|
2482
|
2510
|
2548
|
|
White
|
2363
|
2407
|
2439
|
2466
|
2490
|
2513
|
2536
|
2562
|
2597
|
|
Two or More Races
|
2363
|
2409
|
2441
|
2470
|
2496
|
2520
|
2545
|
2572
|
2610
|
|
Unidentified Race
|
2326
|
2366
|
2397
|
2425
|
2451
|
2477
|
2505
|
2536
|
2575
|
|
EL Status
|
2303
|
2339
|
2363
|
2383
|
2403
|
2423
|
2445
|
2472
|
2509
|
|
IDEA Indicator
|
2276
|
2314
|
2341
|
2364
|
2387
|
2412
|
2441
|
2477
|
2528
|
|
Section 504 Status
|
2361
|
2399
|
2428
|
2453
|
2477
|
2500
|
2524
|
2552
|
2588
|
|
Economic Disadvantage Status
|
2323
|
2361
|
2389
|
2413
|
2436
|
2460
|
2484
|
2513
|
2551
|
Table 8.50: GRADE 5 MATHEMATICS SCALE SCORE BY SELECTED DEMOGRAPHIC GROUPS, 2023-24 PERCENTILES
|
Group
|
P(%)10
|
P(%)20
|
P(%)30
|
P(%)40
|
P(%)50
|
P(%)60
|
P(%)70
|
P(%)80
|
P(%)90
|
|
Total
|
2350
|
2394
|
2427
|
2457
|
2487
|
2516
|
2546
|
2580
|
2623
|
|
Female
|
2352
|
2394
|
2425
|
2454
|
2481
|
2510
|
2539
|
2573
|
2616
|
|
Male
|
2348
|
2395
|
2430
|
2462
|
2493
|
2524
|
2554
|
2587
|
2629
|
|
American Indian or Alaska Native
|
2320
|
2361
|
2389
|
2414
|
2439
|
2465
|
2495
|
2525
|
2571
|
|
Asian
|
2421
|
2478
|
2519
|
2549
|
2576
|
2600
|
2624
|
2651
|
2690
|
|
Black/African American
|
2309
|
2352
|
2381
|
2407
|
2433
|
2459
|
2488
|
2521
|
2566
|
|
Native Hawaiian or Pacific Islander
|
2333
|
2376
|
2403
|
2429
|
2452
|
2480
|
2508
|
2538
|
2578
|
|
Hispanic/Latino Ethnicity
|
2333
|
2374
|
2403
|
2428
|
2452
|
2478
|
2506
|
2537
|
2579
|
|
White
|
2375
|
2421
|
2457
|
2488
|
2515
|
2541
|
2567
|
2596
|
2632
|
|
Two or More Races
|
2374
|
2423
|
2460
|
2493
|
2523
|
2551
|
2578
|
2607
|
2647
|
|
Unidentified Race
|
2340
|
2384
|
2416
|
2446
|
2475
|
2505
|
2535
|
2569
|
2612
|
|
EL Status
|
2306
|
2344
|
2370
|
2391
|
2410
|
2430
|
2454
|
2481
|
2521
|
|
IDEA Indicator
|
2282
|
2320
|
2348
|
2372
|
2395
|
2419
|
2448
|
2487
|
2543
|
|
Section 504 Status
|
2372
|
2413
|
2445
|
2472
|
2500
|
2525
|
2553
|
2584
|
2622
|
|
Economic Disadvantage Status
|
2332
|
2374
|
2403
|
2429
|
2454
|
2481
|
2509
|
2541
|
2584
|
Table 8.51: GRADE 6 MATHEMATICS SCALE SCORE BY SELECTED DEMOGRAPHIC GROUPS, 2023-24 PERCENTILES
|
Group
|
P(%)10
|
P(%)20
|
P(%)30
|
P(%)40
|
P(%)50
|
P(%)60
|
P(%)70
|
P(%)80
|
P(%)90
|
|
Total
|
2343
|
2397
|
2438
|
2473
|
2504
|
2535
|
2567
|
2603
|
2652
|
|
Female
|
2346
|
2397
|
2436
|
2470
|
2500
|
2531
|
2563
|
2599
|
2647
|
|
Male
|
2341
|
2398
|
2441
|
2477
|
2509
|
2540
|
2572
|
2609
|
2657
|
|
American Indian or Alaska Native
|
2306
|
2351
|
2386
|
2417
|
2448
|
2475
|
2506
|
2541
|
2588
|
|
Asian
|
2435
|
2498
|
2541
|
2576
|
2605
|
2632
|
2660
|
2691
|
2734
|
|
Black/African American
|
2300
|
2346
|
2381
|
2413
|
2442
|
2472
|
2502
|
2538
|
2586
|
|
Native Hawaiian or Pacific Islander
|
2321
|
2366
|
2404
|
2434
|
2464
|
2494
|
2522
|
2555
|
2600
|
|
Hispanic/Latino Ethnicity
|
2324
|
2372
|
2407
|
2439
|
2468
|
2496
|
2525
|
2559
|
2604
|
|
White
|
2374
|
2432
|
2472
|
2504
|
2532
|
2560
|
2588
|
2619
|
2661
|
|
Two or More Races
|
2374
|
2433
|
2475
|
2509
|
2539
|
2568
|
2598
|
2631
|
2676
|
|
Unidentified Race
|
2328
|
2379
|
2418
|
2455
|
2488
|
2520
|
2554
|
2592
|
2639
|
|
EL Status
|
2284
|
2327
|
2357
|
2382
|
2405
|
2430
|
2456
|
2486
|
2528
|
|
IDEA Indicator
|
2261
|
2306
|
2337
|
2363
|
2390
|
2418
|
2451
|
2491
|
2549
|
|
Section 504 Status
|
2372
|
2421
|
2457
|
2487
|
2514
|
2540
|
2570
|
2601
|
2647
|
|
Economic Disadvantage Status
|
2323
|
2372
|
2408
|
2440
|
2469
|
2498
|
2528
|
2562
|
2608
|
Table 8.52: GRADE 7 MATHEMATICS SCALE SCORE BY SELECTED DEMOGRAPHIC GROUPS, 2023-24 PERCENTILES
|
Group
|
P(%)10
|
P(%)20
|
P(%)30
|
P(%)40
|
P(%)50
|
P(%)60
|
P(%)70
|
P(%)80
|
P(%)90
|
|
Total
|
2354
|
2405
|
2447
|
2482
|
2515
|
2548
|
2583
|
2622
|
2676
|
|
Female
|
2354
|
2404
|
2443
|
2477
|
2508
|
2541
|
2576
|
2615
|
2670
|
|
Male
|
2353
|
2408
|
2451
|
2488
|
2522
|
2556
|
2590
|
2629
|
2681
|
|
American Indian or Alaska Native
|
2325
|
2370
|
2404
|
2437
|
2466
|
2493
|
2525
|
2563
|
2613
|
|
Asian
|
2442
|
2510
|
2557
|
2595
|
2627
|
2657
|
2687
|
2721
|
2768
|
|
Black/African American
|
2318
|
2361
|
2392
|
2423
|
2452
|
2482
|
2513
|
2550
|
2600
|
|
Native Hawaiian or Pacific Islander
|
2326
|
2373
|
2405
|
2437
|
2466
|
2494
|
2526
|
2562
|
2608
|
|
Hispanic/Latino Ethnicity
|
2334
|
2380
|
2415
|
2447
|
2476
|
2505
|
2536
|
2572
|
2619
|
|
White
|
2385
|
2443
|
2484
|
2517
|
2548
|
2577
|
2606
|
2639
|
2684
|
|
Two or More Races
|
2381
|
2442
|
2483
|
2519
|
2553
|
2584
|
2616
|
2653
|
2701
|
|
Unidentified Race
|
2353
|
2408
|
2452
|
2489
|
2526
|
2563
|
2599
|
2640
|
2694
|
|
EL Status
|
2293
|
2334
|
2361
|
2385
|
2408
|
2432
|
2458
|
2489
|
2535
|
|
IDEA Indicator
|
2283
|
2324
|
2352
|
2376
|
2401
|
2428
|
2460
|
2500
|
2559
|
|
Section 504 Status
|
2381
|
2431
|
2469
|
2500
|
2529
|
2559
|
2589
|
2623
|
2672
|
|
Economic Disadvantage Status
|
2334
|
2380
|
2416
|
2448
|
2478
|
2507
|
2539
|
2576
|
2625
|
Table 8.53: GRADE 8 MATHEMATICS SCALE SCORE BY SELECTED DEMOGRAPHIC GROUPS, 2023-24 PERCENTILES
|
Group
|
P(%)10
|
P(%)20
|
P(%)30
|
P(%)40
|
P(%)50
|
P(%)60
|
P(%)70
|
P(%)80
|
P(%)90
|
|
Total
|
2353
|
2410
|
2450
|
2485
|
2518
|
2554
|
2593
|
2641
|
2706
|
|
Female
|
2359
|
2413
|
2453
|
2486
|
2519
|
2553
|
2591
|
2638
|
2701
|
|
Male
|
2349
|
2407
|
2449
|
2484
|
2518
|
2556
|
2597
|
2647
|
2713
|
|
American Indian or Alaska Native
|
2316
|
2370
|
2408
|
2439
|
2468
|
2494
|
2527
|
2567
|
2624
|
|
Asian
|
2441
|
2510
|
2563
|
2608
|
2647
|
2685
|
2723
|
2764
|
2802
|
|
Black/African American
|
2313
|
2360
|
2396
|
2428
|
2457
|
2486
|
2517
|
2556
|
2613
|
|
Native Hawaiian or Pacific Islander
|
2329
|
2377
|
2411
|
2441
|
2469
|
2497
|
2531
|
2571
|
2627
|
|
Hispanic/Latino Ethnicity
|
2332
|
2383
|
2420
|
2452
|
2480
|
2509
|
2541
|
2581
|
2639
|
|
White
|
2383
|
2442
|
2481
|
2515
|
2549
|
2583
|
2618
|
2659
|
2714
|
|
Two or More Races
|
2381
|
2440
|
2483
|
2519
|
2555
|
2592
|
2633
|
2678
|
2738
|
|
Unidentified Race
|
2369
|
2428
|
2470
|
2507
|
2545
|
2583
|
2622
|
2667
|
2725
|
|
EL Status
|
2284
|
2328
|
2358
|
2384
|
2408
|
2432
|
2457
|
2488
|
2535
|
|
IDEA Indicator
|
2277
|
2321
|
2352
|
2379
|
2404
|
2431
|
2461
|
2498
|
2556
|
|
Section 504 Status
|
2382
|
2435
|
2470
|
2501
|
2531
|
2562
|
2597
|
2640
|
2697
|
|
Economic Disadvantage Status
|
2332
|
2384
|
2421
|
2453
|
2482
|
2512
|
2545
|
2587
|
2647
|
Table 8.54: HIGH SCHOOL MATHEMATICS SCALE SCORE BY SELECTED DEMOGRAPHIC GROUPS, 2023-24 PERCENTILES
|
Group
|
P(%)10
|
P(%)20
|
P(%)30
|
P(%)40
|
P(%)50
|
P(%)60
|
P(%)70
|
P(%)80
|
P(%)90
|
|
Total
|
2373
|
2429
|
2469
|
2504
|
2538
|
2575
|
2615
|
2663
|
2730
|
|
Female
|
2384
|
2436
|
2474
|
2507
|
2539
|
2573
|
2610
|
2656
|
2719
|
|
Male
|
2365
|
2422
|
2465
|
2502
|
2539
|
2578
|
2621
|
2672
|
2743
|
|
American Indian or Alaska Native
|
2347
|
2394
|
2429
|
2462
|
2490
|
2520
|
2554
|
2593
|
2655
|
|
Asian
|
2467
|
2539
|
2593
|
2636
|
2676
|
2714
|
2751
|
2791
|
2848
|
|
Black/African American
|
2332
|
2383
|
2419
|
2449
|
2478
|
2508
|
2542
|
2583
|
2643
|
|
Native Hawaiian or Pacific Islander
|
2357
|
2405
|
2440
|
2468
|
2495
|
2525
|
2558
|
2596
|
2656
|
|
Hispanic/Latino Ethnicity
|
2354
|
2406
|
2443
|
2474
|
2504
|
2534
|
2568
|
2609
|
2666
|
|
White
|
2397
|
2458
|
2501
|
2539
|
2574
|
2610
|
2648
|
2692
|
2751
|
|
Two or More Races
|
2398
|
2458
|
2505
|
2545
|
2583
|
2622
|
2663
|
2711
|
2776
|
|
Unidentified Race
|
2382
|
2437
|
2475
|
2508
|
2540
|
2574
|
2612
|
2658
|
2722
|
|
EL Status
|
2299
|
2347
|
2379
|
2405
|
2429
|
2452
|
2477
|
2507
|
2555
|
|
IDEA Indicator
|
2293
|
2342
|
2374
|
2401
|
2425
|
2450
|
2477
|
2510
|
2562
|
|
Section 504 Status
|
2396
|
2450
|
2487
|
2520
|
2551
|
2584
|
2620
|
2665
|
2729
|
|
Economic Disadvantage Status
|
2354
|
2406
|
2443
|
2474
|
2504
|
2535
|
2570
|
2612
|
2673
|
Composite Claim Score Results
Composite claim scores were reported for the first time in the 2023-24 administration by two member states, California and Idaho. The definition of composite claim scores are as follows:
ELA/literacy:
Mathematics:
Composite Claim 1: Concepts and Procedures
Composite Claim 2: Problem Solving, Communicating Reasoning, and Modeling and Data Analysis
This section reports the reliability of composite claim scores as well as total scores under the adjusted blueprint, using operational student data from 2023-24. Marginal reliability (rho) indicates the extent to which observed score differences reflect true differences in achievement rather than random error. Because composite claims are based on fewer items, their reliabilities are expected to be slightly lower than total score reliabilities, but still adequate for group-level interpretation. Results are disaggregated by demographic group for both ELA/literacy and mathematics, providing evidence that composite claim scores function consistently across student populations.
Reliability
Reliability estimates in this section are based on operational data from the adjusted blueprint. Table 8.55 and Table 8.56 show the reliability of the observed total scores and subscores for ELA/literacy and mathematics.
Table 8.55: MARGINAL RELIABILITY OF TOTAL SUMMATIVE SCORES AND COMPOSITE CLAIM SCORES: ELA/LITERACY
|
Grade
|
N
|
Total score
|
Composite Claim 1
|
Composite Claim 2
|
|
3
|
427,175
|
0.873
|
0.692
|
0.764
|
|
4
|
437,371
|
0.874
|
0.700
|
0.764
|
|
5
|
442,415
|
0.889
|
0.708
|
0.791
|
|
6
|
444,222
|
0.890
|
0.759
|
0.787
|
|
7
|
448,602
|
0.893
|
0.723
|
0.796
|
|
8
|
449,286
|
0.888
|
0.751
|
0.789
|
|
HS
|
459,016
|
0.891
|
0.740
|
0.804
|
Table 8.56: MARGINAL RELIABILITY OF TOTAL SUMMATIVE SCORES AND COMPOSITE CLAIM SCORES: MATHEMATICS
|
Grade
|
N
|
Total score
|
Composite Claim 1
|
Composite Claim 2
|
|
3
|
432,248
|
0.910
|
0.756
|
0.760
|
|
4
|
442,128
|
0.905
|
0.753
|
0.781
|
|
5
|
446,572
|
0.891
|
0.752
|
0.735
|
|
6
|
447,642
|
0.880
|
0.770
|
0.734
|
|
7
|
451,121
|
0.877
|
0.752
|
0.720
|
|
8
|
451,332
|
0.884
|
0.759
|
0.705
|
|
HS
|
458,306
|
0.849
|
0.758
|
0.666
|
Classification Accuracy
The following tables provide estimates of classification accuracy for composite claim scores in addition to total scores. Specifically, Table 8.57 through Table 8.63 show ELA/literacy classification accuracy for each grade 3-8 and high school (HS). Section 2.4 explains how the statistics in these tables were computed. Classification accuracy indicates the probability that a student’s observed composite claim score places them in the same achievement level as their true score for that claim. These results demonstrate how precisely students are classified at the claim level, which is especially relevant for instructional use of Reading/Listening, Writing/Research, Concepts/Procedures, and Problem Solving/Reasoning/Modeling scores.
Table 8.57: GRADE 3 ELA/LITERACY CLASSIFICATION ACCURACY: COMPOSITE CLAIM SCORE
|
Score
|
Observed Level
|
N
|
P
|
True L1
|
True L2
|
True L3
|
True L4
|
Accuracy by Level
|
Accuracy Overall
|
|
Overall
|
Level 1
|
146,506
|
0.343
|
0.300
|
0.042
|
0.001
|
0.000
|
0.875
|
0.755
|
|
Level 2
|
96,758
|
0.227
|
0.043
|
0.140
|
0.042
|
0.001
|
0.618
|
|
Level 3
|
84,246
|
0.197
|
0.001
|
0.042
|
0.116
|
0.039
|
0.586
|
|
Level 4
|
99,667
|
0.233
|
0.000
|
0.001
|
0.033
|
0.199
|
0.853
|
|
CompClaim 1
|
Below
|
124,543
|
0.292
|
0.245
|
0.042
|
0.005
|
0.000
|
0.983
|
0.976
|
|
Near
|
217,594
|
0.510
|
0.099
|
0.177
|
0.152
|
0.082
|
NA
|
|
Above
|
84,866
|
0.199
|
0.000
|
0.006
|
0.035
|
0.157
|
0.969
|
|
CompClaim 2
|
Below
|
154,574
|
0.362
|
0.294
|
0.061
|
0.006
|
0.000
|
0.982
|
0.981
|
|
Near
|
181,444
|
0.425
|
0.049
|
0.160
|
0.151
|
0.065
|
NA
|
|
Above
|
90,951
|
0.213
|
0.000
|
0.004
|
0.035
|
0.174
|
0.981
|
|
Total:
|
All Students
|
427,177
|
1.000
|
NA
|
NA
|
NA
|
NA
|
NA
|
NA
|
Table 8.58: GRADE 4 ELA/LITERACY CLASSIFICATION ACCURACY: COMPOSITE CLAIM SCORE
|
Score
|
Observed Level
|
N
|
P
|
True L1
|
True L2
|
True L3
|
True L4
|
Accuracy by Level
|
Accuracy Overall
|
|
Overall
|
Level 1
|
160,488
|
0.367
|
0.325
|
0.039
|
0.002
|
0.000
|
0.886
|
0.750
|
|
Level 2
|
83,675
|
0.191
|
0.044
|
0.104
|
0.042
|
0.002
|
0.545
|
|
Level 3
|
86,808
|
0.198
|
0.002
|
0.042
|
0.114
|
0.040
|
0.574
|
|
Level 4
|
106,399
|
0.243
|
0.000
|
0.002
|
0.035
|
0.206
|
0.848
|
|
CompClaim 1
|
Below
|
120,900
|
0.277
|
0.247
|
0.026
|
0.004
|
0.000
|
0.986
|
0.976
|
|
Near
|
220,061
|
0.503
|
0.123
|
0.155
|
0.149
|
0.076
|
NA
|
|
Above
|
96,220
|
0.220
|
0.000
|
0.007
|
0.040
|
0.172
|
0.965
|
|
CompClaim 2
|
Below
|
154,057
|
0.352
|
0.302
|
0.044
|
0.007
|
0.000
|
0.980
|
0.981
|
|
Near
|
193,486
|
0.443
|
0.069
|
0.140
|
0.155
|
0.078
|
NA
|
|
Above
|
89,612
|
0.205
|
0.000
|
0.004
|
0.031
|
0.170
|
0.982
|
|
Total:
|
All Students
|
437,370
|
1.000
|
NA
|
NA
|
NA
|
NA
|
NA
|
NA
|
Table 8.59: GRADE 5 ELA/LITERACY CLASSIFICATION ACCURACY: COMPOSITE CLAIM SCORE
|
Score
|
Observed Level
|
N
|
P
|
True L1
|
True L2
|
True L3
|
True L4
|
Accuracy by Level
|
Accuracy Overall
|
|
Overall
|
Level 1
|
145,623
|
0.329
|
0.293
|
0.035
|
0.001
|
0.000
|
0.891
|
0.764
|
|
Level 2
|
85,899
|
0.194
|
0.040
|
0.114
|
0.040
|
0.000
|
0.586
|
|
Level 3
|
112,121
|
0.253
|
0.001
|
0.043
|
0.170
|
0.039
|
0.671
|
|
Level 4
|
98,772
|
0.223
|
0.000
|
0.000
|
0.036
|
0.187
|
0.838
|
|
CompClaim 1
|
Below
|
120,649
|
0.273
|
0.236
|
0.032
|
0.005
|
0.000
|
0.982
|
0.977
|
|
Near
|
222,730
|
0.504
|
0.097
|
0.155
|
0.188
|
0.064
|
NA
|
|
Above
|
98,842
|
0.224
|
0.000
|
0.006
|
0.055
|
0.163
|
0.973
|
|
CompClaim 2
|
Below
|
141,590
|
0.320
|
0.274
|
0.042
|
0.005
|
0.000
|
0.985
|
0.983
|
|
Near
|
188,267
|
0.426
|
0.060
|
0.146
|
0.178
|
0.041
|
NA
|
|
Above
|
112,348
|
0.254
|
0.000
|
0.004
|
0.064
|
0.185
|
0.982
|
|
Total:
|
All Students
|
442,415
|
1.000
|
NA
|
NA
|
NA
|
NA
|
NA
|
NA
|
Table 8.60: GRADE 6 ELA/LITERACY CLASSIFICATION ACCURACY: COMPOSITE CLAIM SCORE
|
Score
|
Observed Level
|
N
|
P
|
True L1
|
True L2
|
True L3
|
True L4
|
Accuracy by Level
|
Accuracy Overall
|
|
Overall
|
Level 1
|
131,506
|
0.296
|
0.260
|
0.036
|
0.000
|
0.000
|
0.878
|
0.768
|
|
Level 2
|
107,874
|
0.243
|
0.040
|
0.162
|
0.041
|
0.000
|
0.666
|
|
Level 3
|
124,101
|
0.279
|
0.000
|
0.044
|
0.197
|
0.038
|
0.704
|
|
Level 4
|
80,738
|
0.182
|
0.000
|
0.000
|
0.032
|
0.150
|
0.823
|
|
CompClaim 1
|
Below
|
140,341
|
0.316
|
0.248
|
0.062
|
0.006
|
0.000
|
0.981
|
0.975
|
|
Near
|
205,201
|
0.462
|
0.051
|
0.173
|
0.194
|
0.044
|
NA
|
|
Above
|
98,247
|
0.221
|
0.000
|
0.007
|
0.070
|
0.145
|
0.970
|
|
CompClaim 2
|
Below
|
149,699
|
0.337
|
0.261
|
0.070
|
0.006
|
0.000
|
0.981
|
0.978
|
|
Near
|
188,550
|
0.425
|
0.039
|
0.166
|
0.187
|
0.032
|
NA
|
|
Above
|
105,600
|
0.238
|
0.000
|
0.006
|
0.077
|
0.156
|
0.976
|
|
Total:
|
All Students
|
444,219
|
1.000
|
NA
|
NA
|
NA
|
NA
|
NA
|
NA
|
Table 8.61: GRADE 7 ELA/LITERACY CLASSIFICATION ACCURACY: COMPOSITE CLAIM SCORE
|
Score
|
Observed Level
|
N
|
P
|
True L1
|
True L2
|
True L3
|
True L4
|
Accuracy by Level
|
Accuracy Overall
|
|
Overall
|
Level 1
|
136,486
|
0.304
|
0.270
|
0.033
|
0.001
|
0.000
|
0.889
|
0.775
|
|
Level 2
|
98,629
|
0.220
|
0.038
|
0.142
|
0.040
|
0.000
|
0.646
|
|
Level 3
|
135,310
|
0.302
|
0.001
|
0.043
|
0.220
|
0.038
|
0.729
|
|
Level 4
|
78,177
|
0.174
|
0.000
|
0.000
|
0.032
|
0.143
|
0.818
|
|
CompClaim 1
|
Below
|
129,398
|
0.289
|
0.233
|
0.048
|
0.008
|
0.000
|
0.973
|
0.973
|
|
Near
|
225,656
|
0.504
|
0.075
|
0.166
|
0.217
|
0.046
|
NA
|
|
Above
|
92,848
|
0.207
|
0.000
|
0.005
|
0.067
|
0.134
|
0.973
|
|
CompClaim 2
|
Below
|
147,309
|
0.329
|
0.267
|
0.057
|
0.005
|
0.000
|
0.985
|
0.981
|
|
Near
|
174,571
|
0.390
|
0.040
|
0.156
|
0.176
|
0.017
|
NA
|
|
Above
|
126,025
|
0.281
|
0.000
|
0.007
|
0.111
|
0.163
|
0.977
|
|
Total:
|
All Students
|
448,602
|
1.000
|
NA
|
NA
|
NA
|
NA
|
NA
|
NA
|
Table 8.62: GRADE 8 ELA/LITERACY CLASSIFICATION ACCURACY: COMPOSITE CLAIM SCORE
|
Score
|
Observed Level
|
N
|
P
|
True L1
|
True L2
|
True L3
|
True L4
|
Accuracy by Level
|
Accuracy Overall
|
|
Overall
|
Level 1
|
132,433
|
0.295
|
0.260
|
0.035
|
0.000
|
0.000
|
0.882
|
0.774
|
|
Level 2
|
109,097
|
0.243
|
0.040
|
0.162
|
0.042
|
0.000
|
0.665
|
|
Level 3
|
135,892
|
0.302
|
0.000
|
0.044
|
0.222
|
0.037
|
0.733
|
|
Level 4
|
71,863
|
0.160
|
0.000
|
0.000
|
0.029
|
0.131
|
0.817
|
|
CompClaim 1
|
Below
|
141,418
|
0.315
|
0.245
|
0.063
|
0.007
|
0.000
|
0.977
|
0.977
|
|
Near
|
211,029
|
0.471
|
0.054
|
0.172
|
0.211
|
0.033
|
NA
|
|
Above
|
96,047
|
0.214
|
0.000
|
0.005
|
0.075
|
0.134
|
0.976
|
|
CompClaim 2
|
Below
|
147,347
|
0.328
|
0.257
|
0.065
|
0.006
|
0.000
|
0.983
|
0.976
|
|
Near
|
184,146
|
0.411
|
0.041
|
0.167
|
0.182
|
0.020
|
NA
|
|
Above
|
117,082
|
0.261
|
0.000
|
0.008
|
0.106
|
0.147
|
0.970
|
|
Total:
|
All Students
|
449,285
|
1.000
|
NA
|
NA
|
NA
|
NA
|
NA
|
NA
|
Table 8.63: HIGH SCHOOL ELA/LITERACY CLASSIFICATION ACCURACY: COMPOSITE CLAIM SCORE
|
Score
|
Observed Level
|
N
|
P
|
True L1
|
True L2
|
True L3
|
True L4
|
Accuracy by Level
|
Accuracy Overall
|
|
Overall
|
Level 1
|
107,270
|
0.234
|
0.204
|
0.029
|
0.000
|
0.000
|
0.873
|
0.774
|
|
Level 2
|
95,770
|
0.209
|
0.032
|
0.140
|
0.037
|
0.000
|
0.670
|
|
Level 3
|
135,685
|
0.296
|
0.000
|
0.043
|
0.209
|
0.043
|
0.708
|
|
Level 4
|
120,291
|
0.262
|
0.000
|
0.000
|
0.041
|
0.221
|
0.843
|
|
CompClaim 1
|
Below
|
109,855
|
0.240
|
0.184
|
0.050
|
0.006
|
0.000
|
0.973
|
0.976
|
|
Near
|
217,292
|
0.475
|
0.050
|
0.157
|
0.208
|
0.059
|
NA
|
|
Above
|
130,628
|
0.285
|
0.000
|
0.006
|
0.073
|
0.206
|
0.979
|
|
CompClaim 2
|
Below
|
123,247
|
0.269
|
0.205
|
0.059
|
0.005
|
0.000
|
0.981
|
0.981
|
|
Near
|
172,300
|
0.376
|
0.029
|
0.147
|
0.173
|
0.027
|
NA
|
|
Above
|
162,226
|
0.354
|
0.000
|
0.007
|
0.110
|
0.238
|
0.981
|
|
Total:
|
All Students
|
459,016
|
1.000
|
NA
|
NA
|
NA
|
NA
|
NA
|
NA
|
Table 8.64: GRADE 3 MATHEMATICS CLASSIFICATION ACCURACY: COMPOSITE CLAIM SCORE
|
Score
|
Observed Level
|
N
|
P
|
True L1
|
True L2
|
True L3
|
True L4
|
Accuracy by Level
|
Accuracy Overall
|
|
Overall
|
Level 1
|
139,340
|
0.322
|
0.286
|
0.036
|
0.001
|
0.000
|
0.888
|
0.793
|
|
Level 2
|
94,745
|
0.219
|
0.037
|
0.144
|
0.038
|
0.000
|
0.656
|
|
Level 3
|
108,314
|
0.251
|
0.000
|
0.038
|
0.182
|
0.031
|
0.726
|
|
Level 4
|
89,848
|
0.208
|
0.000
|
0.000
|
0.027
|
0.181
|
0.872
|
|
CompClaim 1
|
Below
|
131,056
|
0.303
|
0.254
|
0.044
|
0.005
|
0.000
|
0.984
|
0.981
|
|
Near
|
187,927
|
0.435
|
0.069
|
0.167
|
0.169
|
0.030
|
NA
|
|
Above
|
113,136
|
0.262
|
0.000
|
0.006
|
0.074
|
0.182
|
0.977
|
|
CompClaim 2
|
Below
|
158,174
|
0.366
|
0.292
|
0.068
|
0.005
|
0.000
|
0.985
|
0.986
|
|
Near
|
155,943
|
0.361
|
0.031
|
0.145
|
0.165
|
0.019
|
NA
|
|
Above
|
118,029
|
0.273
|
0.000
|
0.003
|
0.077
|
0.192
|
0.987
|
|
Total:
|
All Students
|
432,247
|
1.000
|
NA
|
NA
|
NA
|
NA
|
NA
|
NA
|
Table 8.65: GRADE 4 MATHEMATICS CLASSIFICATION ACCURACY: COMPOSITE CLAIM SCORE
|
Score
|
Observed Level
|
N
|
P
|
True L1
|
True L2
|
True L3
|
True L4
|
Accuracy by Level
|
Accuracy Overall
|
|
Overall
|
Level 1
|
133,671
|
0.302
|
0.265
|
0.037
|
0.000
|
0.000
|
0.877
|
0.799
|
|
Level 2
|
124,791
|
0.282
|
0.038
|
0.207
|
0.037
|
0.000
|
0.734
|
|
Level 3
|
99,108
|
0.224
|
0.000
|
0.035
|
0.160
|
0.029
|
0.715
|
|
Level 4
|
84,553
|
0.191
|
0.000
|
0.000
|
0.024
|
0.167
|
0.872
|
|
CompClaim 1
|
Below
|
148,888
|
0.337
|
0.260
|
0.073
|
0.004
|
0.000
|
0.988
|
0.982
|
|
Near
|
188,673
|
0.427
|
0.043
|
0.201
|
0.155
|
0.028
|
NA
|
|
Above
|
104,433
|
0.236
|
0.000
|
0.006
|
0.063
|
0.167
|
0.977
|
|
CompClaim 2
|
Below
|
177,318
|
0.401
|
0.286
|
0.111
|
0.005
|
0.000
|
0.988
|
0.988
|
|
Near
|
157,404
|
0.356
|
0.017
|
0.166
|
0.153
|
0.021
|
NA
|
|
Above
|
107,287
|
0.243
|
0.000
|
0.003
|
0.065
|
0.175
|
0.987
|
|
Total:
|
All Students
|
442,123
|
1.000
|
NA
|
NA
|
NA
|
NA
|
NA
|
NA
|
Table 8.66: GRADE 5 MATHEMATICS CLASSIFICATION ACCURACY: COMPOSITE CLAIM SCORE
|
Score
|
Observed Level
|
N
|
P
|
True L1
|
True L2
|
True L3
|
True L4
|
Accuracy by Level
|
Accuracy Overall
|
|
Overall
|
Level 1
|
178,478
|
0.400
|
0.353
|
0.046
|
0.001
|
0.000
|
0.883
|
0.794
|
|
Level 2
|
110,297
|
0.247
|
0.040
|
0.170
|
0.036
|
0.001
|
0.690
|
|
Level 3
|
68,841
|
0.154
|
0.000
|
0.031
|
0.096
|
0.027
|
0.620
|
|
Level 4
|
88,954
|
0.199
|
0.000
|
0.000
|
0.024
|
0.175
|
0.879
|
|
CompClaim 1
|
Below
|
172,526
|
0.386
|
0.322
|
0.060
|
0.004
|
0.000
|
0.988
|
0.981
|
|
Near
|
184,498
|
0.413
|
0.071
|
0.183
|
0.115
|
0.044
|
NA
|
|
Above
|
89,397
|
0.200
|
0.000
|
0.005
|
0.036
|
0.159
|
0.974
|
|
CompClaim 2
|
Below
|
197,866
|
0.443
|
0.353
|
0.085
|
0.005
|
0.000
|
0.988
|
0.987
|
|
Near
|
163,060
|
0.365
|
0.039
|
0.161
|
0.122
|
0.043
|
NA
|
|
Above
|
85,512
|
0.192
|
0.000
|
0.003
|
0.029
|
0.160
|
0.987
|
|
Total:
|
All Students
|
446,570
|
1.000
|
NA
|
NA
|
NA
|
NA
|
NA
|
NA
|
Table 8.67: GRADE 6 MATHEMATICS CLASSIFICATION ACCURACY: COMPOSITE CLAIM SCORE
|
Score
|
Observed Level
|
N
|
P
|
True L1
|
True L2
|
True L3
|
True L4
|
Accuracy by Level
|
Accuracy Overall
|
|
Overall
|
Level 1
|
180,089
|
0.402
|
0.359
|
0.043
|
0.001
|
0.000
|
0.892
|
0.797
|
|
Level 2
|
112,699
|
0.252
|
0.040
|
0.175
|
0.037
|
0.001
|
0.693
|
|
Level 3
|
71,735
|
0.160
|
0.000
|
0.032
|
0.100
|
0.028
|
0.627
|
|
Level 4
|
83,121
|
0.186
|
0.000
|
0.000
|
0.023
|
0.163
|
0.877
|
|
CompClaim 1
|
Below
|
190,026
|
0.425
|
0.351
|
0.069
|
0.004
|
0.000
|
0.990
|
0.985
|
|
Near
|
176,752
|
0.395
|
0.047
|
0.177
|
0.124
|
0.047
|
NA
|
|
Above
|
80,641
|
0.180
|
0.000
|
0.004
|
0.032
|
0.145
|
0.979
|
|
CompClaim 2
|
Below
|
199,369
|
0.446
|
0.359
|
0.081
|
0.005
|
0.000
|
0.989
|
0.986
|
|
Near
|
162,866
|
0.364
|
0.039
|
0.165
|
0.124
|
0.036
|
NA
|
|
Above
|
85,265
|
0.191
|
0.000
|
0.003
|
0.032
|
0.156
|
0.984
|
|
Total:
|
All Students
|
447,644
|
1.000
|
NA
|
NA
|
NA
|
NA
|
NA
|
NA
|
Table 8.68: GRADE 7 MATHEMATICS CLASSIFICATION ACCURACY: COMPOSITE CLAIM SCORE
|
Score
|
Observed Level
|
N
|
P
|
True L1
|
True L2
|
True L3
|
True L4
|
Accuracy by Level
|
Accuracy Overall
|
|
Overall
|
Level 1
|
184,988
|
0.410
|
0.363
|
0.047
|
0.001
|
0.000
|
0.884
|
0.794
|
|
Level 2
|
111,568
|
0.247
|
0.042
|
0.166
|
0.038
|
0.001
|
0.672
|
|
Level 3
|
76,838
|
0.170
|
0.000
|
0.032
|
0.113
|
0.026
|
0.661
|
|
Level 4
|
77,725
|
0.172
|
0.000
|
0.000
|
0.020
|
0.153
|
0.886
|
|
CompClaim 1
|
Below
|
185,844
|
0.412
|
0.346
|
0.062
|
0.004
|
0.000
|
0.991
|
0.984
|
|
Near
|
179,546
|
0.398
|
0.058
|
0.179
|
0.128
|
0.034
|
NA
|
|
Above
|
85,338
|
0.189
|
0.000
|
0.004
|
0.039
|
0.146
|
0.978
|
|
CompClaim 2
|
Below
|
195,148
|
0.433
|
0.354
|
0.074
|
0.005
|
0.000
|
0.989
|
0.988
|
|
Near
|
172,354
|
0.382
|
0.051
|
0.169
|
0.133
|
0.030
|
NA
|
|
Above
|
83,354
|
0.185
|
0.000
|
0.002
|
0.034
|
0.149
|
0.988
|
|
Total:
|
All Students
|
451,119
|
1.000
|
NA
|
NA
|
NA
|
NA
|
NA
|
NA
|
Table 8.69: GRADE 8 MATHEMATICS CLASSIFICATION ACCURACY: COMPOSITE CLAIM SCORE
|
Score
|
Observed Level
|
N
|
P
|
True L1
|
True L2
|
True L3
|
True L4
|
Accuracy by Level
|
Accuracy Overall
|
|
Overall
|
Level 1
|
207,714
|
0.460
|
0.408
|
0.051
|
0.001
|
0.000
|
0.886
|
0.797
|
|
Level 2
|
99,387
|
0.220
|
0.043
|
0.139
|
0.037
|
0.001
|
0.630
|
|
Level 3
|
61,611
|
0.137
|
0.000
|
0.027
|
0.086
|
0.023
|
0.628
|
|
Level 4
|
82,619
|
0.183
|
0.000
|
0.000
|
0.018
|
0.165
|
0.902
|
|
CompClaim 1
|
Below
|
185,045
|
0.410
|
0.358
|
0.047
|
0.004
|
0.000
|
0.989
|
0.983
|
|
Near
|
184,977
|
0.410
|
0.092
|
0.166
|
0.110
|
0.042
|
NA
|
|
Above
|
80,843
|
0.179
|
0.000
|
0.004
|
0.028
|
0.147
|
0.977
|
|
CompClaim 2
|
Below
|
198,721
|
0.441
|
0.376
|
0.060
|
0.005
|
0.000
|
0.990
|
0.989
|
|
Near
|
167,733
|
0.372
|
0.075
|
0.155
|
0.111
|
0.031
|
NA
|
|
Above
|
84,531
|
0.187
|
0.000
|
0.002
|
0.027
|
0.158
|
0.989
|
|
Total:
|
All Students
|
451,331
|
1.000
|
NA
|
NA
|
NA
|
NA
|
NA
|
NA
|
Table 8.70: HIGH SCHOOL MATHEMATICS CLASSIFICATION ACCURACY: COMPOSITE CLAIM SCORE
|
Score
|
Observed Level
|
N
|
P
|
True L1
|
True L2
|
True L3
|
True L4
|
Accuracy by Level
|
Accuracy Overall
|
|
Overall
|
Level 1
|
232,160
|
0.507
|
0.450
|
0.055
|
0.002
|
0.000
|
0.888
|
0.808
|
|
Level 2
|
97,600
|
0.213
|
0.041
|
0.137
|
0.035
|
0.000
|
0.643
|
|
Level 3
|
72,321
|
0.158
|
0.000
|
0.026
|
0.113
|
0.019
|
0.713
|
|
Level 4
|
56,227
|
0.123
|
0.000
|
0.000
|
0.014
|
0.109
|
0.889
|
|
CompClaim 1
|
Below
|
220,276
|
0.481
|
0.413
|
0.062
|
0.006
|
0.000
|
0.988
|
0.982
|
|
Near
|
168,546
|
0.368
|
0.076
|
0.153
|
0.118
|
0.021
|
NA
|
|
Above
|
68,981
|
0.151
|
0.000
|
0.004
|
0.040
|
0.107
|
0.975
|
|
CompClaim 2
|
Below
|
213,722
|
0.467
|
0.400
|
0.062
|
0.005
|
0.000
|
0.990
|
0.985
|
|
Near
|
170,784
|
0.373
|
0.090
|
0.153
|
0.115
|
0.014
|
NA
|
|
Above
|
73,336
|
0.160
|
0.000
|
0.003
|
0.043
|
0.114
|
0.980
|
|
Total:
|
All Students
|
458,308
|
1.000
|
NA
|
NA
|
NA
|
NA
|
NA
|
NA
|
Standard Errors of Measurement
Figure 8.15 to Figure 8.27 are scatter plots of a random sample of 2,000 individual student SEMs as a function of scale score for the total test and claims/subscores by grade within subject. These plots show the standard error of measurement (SEM) curves for composite claim scores alongside total scores for each grade. SEM curves reveal how precise the score estimates are across the range of achievement. As expected, SEMs for composite claims are somewhat larger than for total scores due to the smaller number of items contributing to each claim, but they remain within acceptable limits for reporting. These figures allow states and educators to understand where claim-level results are most precise and where caution should be used when interpreting individual student scores.
Dashed vertical lines in Figure 8.15 to Figure 8.27 represent the achievement level cut scores. The plots for the high school standard errors show cut scores for each grade 9, 10, and 11, respectively.