Chapter 2 Reliability, Precision, and Errors of Measurement
2.1 Introduction
This chapter addresses the technical quality of operational test functioning with regard to precision and reliability. Part of the test validity argument is that scores must be consistent and precise enough to be useful for intended purposes. If scores are to be meaningful, tests should deliver the same results under repeated administrations to the same student or for students of the same ability. In addition, the range of certainty around the score should be small enough to support educational decisions. The reliability and precision of a test are examined through analysis of measurement error and other test properties in simulated and operational conditions. For example, the reliability of a test may be assessed in part by verifying that different test forms follow the same blueprint. In computer adaptive testing (CAT), one cannot expect the same set of items to be administered to the same examinee more than once. Consequently, reliability is inferred from internal test properties, including test length and the information provided by item parameters. Measurement precision is enhanced when the student receives items that are well matched, in terms of difficulty, to the overall performance level of the student. Measurement precision is also enhanced when the items a student receives work well together to measure the same general body of knowledge, skills, and abilities defined by the test blueprint. Smarter Balanced uses an adaptive model because adaptive tests are customized to each student in terms of the difficulty of the items. Smarter Balanced used item quality control procedures that ensure test items measure the knowledge, skills, and abilities specified in the test blueprint and work well together in this respect. The expected outcome of these and other test administration and item quality control procedures is high reliability and low measurement error.
For the 2023-24 administration, all statistics in this chapter are based on the full blueprint. Measurement bias from the simulation results produced by Cambium Assessment are provided, along with reliability, classification accuracy, and standard errors of measurement based on student data provided by Connecticut, Michigan, Nevada, and South Dakota. Statistics about the paper/pencil forms are based on the items on the forms, not the students who took the assessment in 2023-24.
2.2 Measurement Bias
Measurement bias is any systematic or non-random error that occurs in estimating a student’s achievement from the student’s scores on test items. Prior to the release of the 2023-24 item pool, simulation studies were carried out to ensure that the item pool, combined with the adaptive test administration algorithm, would produce satisfactory tests with regard to measurement bias and random measurement error as a function of student achievement, overall reliability, fulfillment of test blueprints, and item exposure.
Results for measurement bias with the full blueprint are provided in this section. Measurement bias is the one index of test performance that is clearly and preferentially assessed through simulation as opposed to the use of real data. With real data, true student achievement is unknown. In simulation, true student achievement can be assumed and used to generate item responses. The simulated item responses are used in turn to estimate achievement. Achievement estimates are then compared to the underlying assumed, true values of student achievement to assess whether the estimates contain systematic error (bias).
Simulations for the 2023-24 administration were carried out by Cambium Assessment. The simulations were performed for each grade within a subject area for the standard item pool (English) and for accommodation item pools of braille and Spanish for mathematics and braille for ELA/literacy. For the standard item pools, the number of simulees was 3,000 for grades 3-8 and 5,000 for grade 11. For the braille and Spanish pools, the number of simulees was 1,000 for grades 3-8 and 2,000 for grade 11. True student achievement values were sampled from a normal distribution for each grade and subject. The parameters for the normal distribution were based on students’ operational scores on the 2018–2019 Smarter Balanced summative tests.
Test events were created for the simulated examinees using the 2023-24 item pool. Estimated ability ( \(\hat{\theta}\) ) was calculated from the simulated tests using maximum likelihood estimation (MLE) as described in the Smarter Balanced Test Scoring Specifications (Smarter Balanced, 2023b).
Bias was computed as:
\[\begin{equation} bias = N^{-1}\sum_{i = 1}^{N} (\theta_{i} - \hat{\theta}_{i}) \tag{2.1} \end{equation}\]
and the error variance of the estimated bias is:
\[\begin{equation} ErrorVar(bias) = \frac{1}{N(N-1)}\sum_{i = 1}^{N} (\theta_{i} - \hat{\theta}_{i}-mean(\theta_{i}-\hat{\theta}_{i}))^{2} \tag{2.2} \end{equation}\]
where \(\theta_{i} - \hat{\theta}\) is the deviation score, and \(N\) denotes the number of simulees (\(N = 1000\) for all conditions). Statistical significance of the bias is tested using a z-test: \[\begin{equation} z = \frac{bias}{\sqrt{ErrorVar(bias)}} \tag{2.3} \end{equation}\]
Table 2.1 and Table 2.2 show for ELA/literacy and mathematics, respectively, the bias in estimates of student achievement based on the complete test assembled from the standard item pool and the accommodations pools included in the simulations. The standard error of bias is the denominator of the z-score in Equation (2.3). The p-value is the probability \(|Z| > |z|\) where \(Z\) is a standard normal variate and \(|z|\) is the absolute value of the \(z\) computed in Equation (2.3). Under the hypothesis of no bias, approximately 5% and 1% of the \(\theta_{i}\) will fall outside, respectively, 95% and 99% confidence intervals centered on \(\theta_{i}\).
Mean bias was generally very small in practical terms, exceeding .02 in absolute value in no cases for ELA/literacy and in only six cases for mathematics. Mean bias tended to be statistically significantly different from 0, but this was due to the large sample sizes used for the simulation. In virtually all cases, the percentage of simulated examinees whose estimated achievement score fell outside the confidence intervals centered on their true score was close to expected values of 5% for the 95% confidence interval and 1% for the 99% confidence interval. Plots of bias by estimated theta in the full simulation report show that positive and statistically significant mean bias was due to thetas being underestimated in regions of student achievement far below the lowest cut score (separating achievement levels 1 and 2). The same plots show that estimation bias is negligible near all cut scores in all cases.
| Pool | Grade | Mean Bias | SE (Bias) | P value | MSE | 95% CI Miss Rate | 99% CI Miss Rate |
|---|---|---|---|---|---|---|---|
| Standard | 3 | -0.01 | 0.01 | 0.42 | 0.12 | 5.01% | 0.73% |
| 4 | 0.00 | 0.01 | 0.87 | 0.13 | 4.83% | 0.93% | |
| 5 | 0.00 | 0.01 | 0.51 | 0.13 | 5.00% | 1.07% | |
| 6 | -0.01 | 0.01 | 0.22 | 0.15 | 5.03% | 1.00% | |
| 7 | 0.00 | 0.01 | 0.65 | 0.15 | 5.03% | 1.20% | |
| 8 | 0.00 | 0.01 | 0.80 | 0.17 | 4.47% | 0.93% | |
| HS | 0.01 | 0.01 | 0.17 | 0.19 | 4.66% | 0.78% | |
| Braille | 3 | 0.01 | 0.01 | 0.64 | 0.14 | 4.61% | 1.30% |
| 4 | 0.01 | 0.01 | 0.46 | 0.14 | 5.30% | 0.70% | |
| 5 | -0.02 | 0.01 | 0.17 | 0.13 | 4.70% | 0.80% | |
| 6 | -0.01 | 0.01 | 0.57 | 0.13 | 4.30% | 0.80% | |
| 7 | -0.02 | 0.01 | 0.06 | 0.17 | 5.30% | 0.40% | |
| 8 | 0.00 | 0.01 | 0.92 | 0.18 | 4.10% | 0.60% | |
| HS | 0.01 | 0.01 | 0.36 | 0.19 | 4.66% | 0.75% |
| Pool | Grade | Mean Bias | SE (Bias) | P value | MSE | 95% CI Miss Rate | 99% CI Miss Rate |
|---|---|---|---|---|---|---|---|
| Standard | 3 | 0.01 | 0.00 | 0.03 | 0.07 | 4.80% | 0.73% |
| 4 | 0.01 | 0.01 | 0.29 | 0.08 | 5.14% | 1.03% | |
| 5 | 0.00 | 0.01 | 0.44 | 0.11 | 5.60% | 0.97% | |
| 6 | 0.02 | 0.01 | < 0.005 | 0.13 | 4.97% | 1.03% | |
| 7 | 0.03 | 0.01 | < 0.005 | 0.15 | 4.77% | 0.83% | |
| 8 | 0.02 | 0.01 | 0.01 | 0.20 | 4.37% | 0.93% | |
| HS | 0.04 | 0.01 | < 0.005 | 0.23 | 4.82% | 1.06% | |
| Braille | 3 | 0.00 | 0.01 | 0.66 | 0.09 | 4.30% | 1.10% |
| 4 | 0.01 | 0.01 | 0.14 | 0.08 | 4.50% | 0.60% | |
| 5 | 0.01 | 0.01 | 0.51 | 0.12 | 3.71% | 0.40% | |
| 6 | 0.03 | 0.01 | 0.01 | 0.18 | 4.61% | 0.80% | |
| 7 | 0.02 | 0.01 | 0.19 | 0.18 | 5.12% | 1.50% | |
| 8 | 0.03 | 0.01 | 0.03 | 0.19 | 4.52% | 0.60% | |
| HS | 0.06 | 0.01 | < 0.005 | 0.27 | 4.42% | 0.95% | |
| Spanish | 3 | -0.01 | 0.01 | 0.55 | 0.08 | 4.91% | 0.80% |
| 4 | 0.01 | 0.01 | 0.42 | 0.09 | 3.50% | 0.70% | |
| 5 | -0.01 | 0.01 | 0.42 | 0.12 | 4.21% | 1.00% | |
| 6 | 0.00 | 0.01 | 0.83 | 0.16 | 5.01% | 1.40% | |
| 7 | 0.05 | 0.01 | < 0.005 | 0.17 | 5.02% | 0.90% | |
| 8 | 0.03 | 0.01 | 0.02 | 0.20 | 4.00% | 0.80% | |
| HS | 0.06 | 0.01 | < 0.005 | 0.27 | 4.56% | 1.10% |
2.3 Reliability
Reliability estimates reported in this section are derived from internal, IRT-based estimates of the measurement error in the test scores of examinees (MSE) and the observed variance of examinees’ test scores on the \(\theta\)-scale \((var(\hat{\theta}))\). The formula for the reliability estimate (\(\rho\)) is:
\[\begin{equation} \hat{\rho} = 1 - \frac{MSE}{var(\hat{\theta})}. \tag{2.4} \end{equation}\]
According to Smarter Balanced Test Scoring Specifications (Smarter Balanced, 2023b), estimates of measurement error are obtained from the parameter estimates of the items taken by the examinees. This is done by computing the test information for each examinee \(i\) as:
\[\begin{equation} I({\theta}_{j}) = \sum_{i=1} 1.7^2 a_i^2 \left\{\sum_{v=0}^{m_i-1} v^2 p_{iv}(z_{ij} = v) - \left[\sum_{v=0}^{m_i-1} v p_{iv}(z_{ij} = v)\right]^2 \right\}. \tag{2.5} \end{equation}\]
where \(p_{iv}(z_{ij} = v)\) is the probability of responding in scoring category \(v\) where \(v=0,1,...,m_i-1\). When the item is based on the 2PL model, \(m_i=2\) and Equation (2.5) simplifies to
\[\begin{equation} I({\theta}_{j}) = \sum_{i=1} 1.7^2 a_i^2 \left[p_{i}(z_{ij} = 1) - p_{i}(z_{ij} = 1)^2 \right], \tag{2.6} \end{equation}\]
The test information is computed using only the items answered by the examinee. The measurement error (SEM) for examinee \(i\) is then computed as:
\[\begin{equation} SEM(\hat{\theta_i}) = \frac{1}{\sqrt{I(\hat{\theta_i})}}. \tag{2.7} \end{equation}\]
The upper bound of \(SEM(\hat{\theta_i})\) is set to 2.5. Any value larger than 2.5 is truncated at 2.5. The mean squared error for a group of \(N\) examinees is then:
\[\begin{equation} MSE = N^{-1}\sum_{i=1}^N SEM(\hat{\theta_i})^2 \tag{2.8} \end{equation}\]
and the variance of the achievement scores is: \[\begin{equation} var(\hat{\theta}) = N^{-1}\sum_{i=1}^N SEM(\hat{\theta_i} - \overline{\hat{\theta}})^2 \tag{2.9} \end{equation}\]
where \(\overline{\hat{\theta}}\) is the average of the \(\hat{\theta_i}\).
The measurement error for a group of examinees is typically reported as the square root of \(MSE\) and is denoted \(RMSE\). Measurement error is computed with Equation (2.7) and Equation (2.8) on a scale where achievement has a standard deviation close to 1 among students at a given grade. Measurement error reported in the tables of this section is transformed to the reporting scale by multiplying the theta-scale measurement error by \(a\), where \(a\) is the slope used to convert estimates of student achievement on the \(\theta\)-scale to the reporting scale. The transformation equations for converting estimates of student achievement on the \(\theta\)-scale to the reporting scale are given in Chapter 5.
2.3.1 General Population
Reliability estimates in this section are based on real data and the full blueprint. In mathematics, claims 2 and 4 are reported together as a single subscore, so there are only three reporting categories for mathematics, but four claims. Table 2.3 and Table 2.4 show the reliability of the observed total scores and subscores for ELA/Literacy and mathematics. Reliability estimates are high for the total score in both subjects. Reliability coefficients are high for the claim 1 score in mathematics, moderately high for the claim 1 and claim 2 scores in ELA/Literacy, and moderately high to moderate for the remainder of the claim scores in both subjects. The lowest reliability coefficient in either subject is .598, which is the reliability of the claim 3 score in the grade 8 ELA/Literacy assessment.
| Grade | N | Total score | Claim 1 | Claim 2 | Claim 3 | Claim 4 |
|---|---|---|---|---|---|---|
| 3 | 176,408 | 0.934 | 0.790 | 0.705 | 0.598 | 0.730 |
| 4 | 180,851 | 0.933 | 0.803 | 0.728 | 0.616 | 0.696 |
| 5 | 180,940 | 0.938 | 0.814 | 0.746 | 0.634 | 0.759 |
| 6 | 180,817 | 0.929 | 0.787 | 0.759 | 0.614 | 0.719 |
| 7 | 182,102 | 0.925 | 0.787 | 0.773 | 0.623 | 0.687 |
| 8 | 83,305 | 0.918 | 0.794 | 0.741 | 0.629 | 0.685 |
| HS | 9,876 | 0.911 | 0.772 | 0.740 | 0.618 | 0.695 |
| Grade | N | Total score | Claim 1 | Claim 2/4 | Claim 3 |
|---|---|---|---|---|---|
| 3 | 176,592 | 0.958 | 0.929 | 0.723 | 0.766 |
| 4 | 180,948 | 0.957 | 0.928 | 0.767 | 0.748 |
| 5 | 180,984 | 0.946 | 0.910 | 0.689 | 0.737 |
| 6 | 180,688 | 0.948 | 0.919 | 0.733 | 0.666 |
| 7 | 181,881 | 0.944 | 0.907 | 0.738 | 0.725 |
| 8 | 82,827 | 0.928 | 0.903 | 0.638 | 0.650 |
| HS | 9,893 | 0.929 | 0.890 | 0.692 | 0.677 |
2.3.2 Demographic Groups
Reliability estimates in this section are based on real data and the full blueprint. During the 2021-22 administration year, most students and schools went back to normal testing. However, schools responded differently to post-pandemic test administration. Many states maintained remote testing and some states switched to the adjusted blueprint. Consequently, demographic groups results presented below should not be considered representative of the entire student population. Table 2.5 and Table 2.6 show the reliability of the test for students of different racial groups in ELA/literacy and mathematics who tested in 2023-24. Table 2.7 and Table 2.8 show the reliability of the test for students who tested in 2023-24, grouped by demographics typically requiring accommodations or accessibility tools. The groups include English learners (EL) and students falling under the Individuals with Disabilities Education Act (IDEA).
Because of the differences in average score across demographic groups and the relationship between measurement error and student achievement scores, which will be seen in the next section of this chapter, demographic groups with lower average scores tend to have lower reliability than the population as a whole. Nevertheless, the reliability coefficients for all demographic groups in these tables are moderately high to high.
| Grade | Group | N | Var | MSE | Rho |
|---|---|---|---|---|---|
| 3 | Total | 176,408 | 7982 | 525 | 0.934 |
| Native American or Alaska Native | 3,657 | 7076 | 716 | 0.899 | |
| Asian | 8,432 | 8207 | 562 | 0.932 | |
| Black/African American | 28,842 | 6688 | 550 | 0.918 | |
| Native Hawaiian or Pacific Islander | 1,005 | 8071 | 612 | 0.924 | |
| Hispanic/Latino Ethnicity | 35,254 | 7440 | 593 | 0.920 | |
| White | 104,313 | 7499 | 523 | 0.930 | |
| 4 | Total | 180,851 | 9143 | 614 | 0.933 |
| Native American or Alaska Native | 3,446 | 8643 | 809 | 0.906 | |
| Asian | 8,440 | 9342 | 655 | 0.930 | |
| Black/African American | 29,978 | 7711 | 643 | 0.917 | |
| Native Hawaiian or Pacific Islander | 1,028 | 9181 | 719 | 0.922 | |
| Hispanic/Latino Ethnicity | 36,302 | 8663 | 687 | 0.921 | |
| White | 106,919 | 8452 | 613 | 0.928 | |
| 5 | Total | 180,940 | 9439 | 583 | 0.938 |
| Native American or Alaska Native | 3,327 | 9335 | 756 | 0.919 | |
| Asian | 8,728 | 9600 | 648 | 0.933 | |
| Black/African American | 29,564 | 7833 | 583 | 0.926 | |
| Native Hawaiian or Pacific Islander | 995 | 9517 | 706 | 0.926 | |
| Hispanic/Latino Ethnicity | 37,048 | 8964 | 640 | 0.929 | |
| White | 107,161 | 8933 | 595 | 0.933 | |
| 6 | Total | 180,817 | 9370 | 668 | 0.929 |
| Native American or Alaska Native | 3,109 | 8688 | 807 | 0.907 | |
| Asian | 8,815 | 9361 | 721 | 0.923 | |
| Black/African American | 29,253 | 7554 | 695 | 0.908 | |
| Native Hawaiian or Pacific Islander | 1,044 | 8680 | 748 | 0.914 | |
| Hispanic/Latino Ethnicity | 37,139 | 8774 | 745 | 0.915 | |
| White | 107,137 | 8857 | 665 | 0.925 | |
| 7 | Total | 182,102 | 10249 | 773 | 0.925 |
| Native American or Alaska Native | 3,227 | 9723 | 987 | 0.898 | |
| Asian | 8,453 | 9980 | 788 | 0.921 | |
| Black/African American | 29,630 | 8747 | 844 | 0.903 | |
| Native Hawaiian or Pacific Islander | 995 | 10047 | 857 | 0.915 | |
| Hispanic/Latino Ethnicity | 37,582 | 10069 | 862 | 0.914 | |
| White | 108,179 | 9731 | 773 | 0.921 | |
| 8 | Total | 83,305 | 11517 | 943 | 0.918 |
| Native American or Alaska Native | 2,524 | 10043 | 1091 | 0.891 | |
| Asian | 4,890 | 10580 | 938 | 0.911 | |
| Black/African American | 11,949 | 10009 | 1025 | 0.898 | |
| Native Hawaiian or Pacific Islander | 875 | 10206 | 902 | 0.912 | |
| Hispanic/Latino Ethnicity | 28,565 | 10436 | 958 | 0.908 | |
| White | 45,631 | 11261 | 998 | 0.911 | |
| HS | Total | 9,876 | 11920 | 1063 | 0.911 |
| Native American or Alaska Native | 857 | 10812 | 1110 | 0.897 | |
| Asian | 163 | 11056 | 1067 | 0.904 | |
| Black/African American | 303 | 11008 | 1083 | 0.902 | |
| Native Hawaiian or Pacific Islander | 15 | 7196 | 993 | 0.862 | |
| Hispanic/Latino Ethnicity | 744 | 13666 | 1119 | 0.918 | |
| White | 7,351 | 10705 | 1051 | 0.902 |
| Grade | Group | N | Var | MSE | Rho |
|---|---|---|---|---|---|
| 3 | Total | 176,592 | 7990 | 334 | 0.958 |
| Native American or Alaska Native | 3,654 | 6680 | 413 | 0.938 | |
| Asian | 8,489 | 7853 | 346 | 0.956 | |
| Black/African American | 28,800 | 6884 | 390 | 0.943 | |
| Native Hawaiian or Pacific Islander | 1,006 | 7537 | 341 | 0.955 | |
| Hispanic/Latino Ethnicity | 35,408 | 7115 | 364 | 0.949 | |
| White | 104,303 | 7093 | 319 | 0.955 | |
| 4 | Total | 180,948 | 8217 | 351 | 0.957 |
| Native American or Alaska Native | 3,441 | 6943 | 452 | 0.935 | |
| Asian | 8,500 | 8308 | 379 | 0.954 | |
| Black/African American | 29,933 | 6982 | 451 | 0.935 | |
| Native Hawaiian or Pacific Islander | 1,027 | 7900 | 367 | 0.954 | |
| Hispanic/Latino Ethnicity | 36,365 | 7549 | 386 | 0.949 | |
| White | 106,891 | 7068 | 321 | 0.955 | |
| 5 | Total | 180,984 | 9069 | 485 | 0.946 |
| Native American or Alaska Native | 3,323 | 7740 | 682 | 0.912 | |
| Asian | 8,792 | 9132 | 425 | 0.953 | |
| Black/African American | 29,523 | 7087 | 650 | 0.908 | |
| Native Hawaiian or Pacific Islander | 993 | 8626 | 519 | 0.940 | |
| Hispanic/Latino Ethnicity | 37,104 | 8031 | 557 | 0.931 | |
| White | 107,108 | 8146 | 440 | 0.946 | |
| 6 | Total | 180,688 | 11466 | 601 | 0.948 |
| Native American or Alaska Native | 3,110 | 10844 | 875 | 0.919 | |
| Asian | 8,849 | 11300 | 493 | 0.956 | |
| Black/African American | 29,175 | 9946 | 837 | 0.916 | |
| Native Hawaiian or Pacific Islander | 1,036 | 9468 | 657 | 0.931 | |
| Hispanic/Latino Ethnicity | 37,141 | 9979 | 716 | 0.928 | |
| White | 107,004 | 10163 | 535 | 0.947 | |
| 7 | Total | 181,881 | 12536 | 708 | 0.944 |
| Native American or Alaska Native | 3,220 | 10259 | 991 | 0.903 | |
| Asian | 8,492 | 12926 | 532 | 0.959 | |
| Black/African American | 29,539 | 10110 | 1003 | 0.901 | |
| Native Hawaiian or Pacific Islander | 988 | 11409 | 814 | 0.929 | |
| Hispanic/Latino Ethnicity | 37,554 | 10762 | 862 | 0.920 | |
| White | 107,964 | 11469 | 619 | 0.946 | |
| 8 | Total | 82,827 | 13714 | 985 | 0.928 |
| Native American or Alaska Native | 2,511 | 11058 | 1306 | 0.882 | |
| Asian | 4,878 | 14078 | 757 | 0.946 | |
| Black/African American | 11,844 | 11150 | 1226 | 0.890 | |
| Native Hawaiian or Pacific Islander | 865 | 10957 | 1006 | 0.908 | |
| Hispanic/Latino Ethnicity | 28,354 | 11229 | 1135 | 0.899 | |
| White | 45,380 | 14011 | 924 | 0.934 | |
| HS | Total | 9,893 | 13412 | 949 | 0.929 |
| Native American or Alaska Native | 857 | 8493 | 1329 | 0.844 | |
| Asian | 162 | 13052 | 874 | 0.933 | |
| Black/African American | 307 | 10943 | 1180 | 0.892 | |
| Native Hawaiian or Pacific Islander | 15 | 10903 | 1066 | 0.902 | |
| Hispanic/Latino Ethnicity | 756 | 11993 | 1152 | 0.904 | |
| White | 7,355 | 12212 | 873 | 0.929 |
| Grade | Group | N | Var | MSE | Rho |
|---|---|---|---|---|---|
| 3 | Total | 176,408 | 7982 | 525 | 0.934 |
| EL Status | 12,156 | 6183 | 679 | 0.890 | |
| IDEA Indicator | 12,561 | 6878 | 731 | 0.894 | |
| Section 504 Status | 2,356 | 8079 | 720 | 0.911 | |
| Economic Disadvantage Status | 46,969 | 7821 | 625 | 0.920 | |
| 4 | Total | 180,851 | 9143 | 614 | 0.933 |
| EL Status | 12,149 | 7006 | 809 | 0.885 | |
| IDEA Indicator | 13,479 | 8178 | 837 | 0.898 | |
| Section 504 Status | 2,907 | 9169 | 838 | 0.909 | |
| Economic Disadvantage Status | 48,809 | 9021 | 724 | 0.920 | |
| 5 | Total | 180,940 | 9439 | 583 | 0.938 |
| EL Status | 10,168 | 6281 | 751 | 0.880 | |
| IDEA Indicator | 12,929 | 8247 | 780 | 0.905 | |
| Section 504 Status | 3,225 | 10000 | 828 | 0.917 | |
| Economic Disadvantage Status | 49,198 | 9467 | 675 | 0.929 | |
| 6 | Total | 180,817 | 9370 | 668 | 0.929 |
| EL Status | 9,030 | 4968 | 901 | 0.819 | |
| IDEA Indicator | 12,107 | 7318 | 905 | 0.876 | |
| Section 504 Status | 4,720 | 11429 | 890 | 0.922 | |
| Economic Disadvantage Status | 48,159 | 9274 | 793 | 0.915 | |
| 7 | Total | 182,102 | 10249 | 773 | 0.925 |
| EL Status | 9,118 | 6383 | 1095 | 0.828 | |
| IDEA Indicator | 11,603 | 8551 | 1098 | 0.872 | |
| Section 504 Status | 5,034 | 11885 | 1014 | 0.915 | |
| Economic Disadvantage Status | 47,973 | 10577 | 884 | 0.916 | |
| 8 | Total | 83,305 | 11517 | 943 | 0.918 |
| EL Status | 8,363 | 5767 | 1143 | 0.802 | |
| IDEA Indicator | 11,668 | 8325 | 1159 | 0.861 | |
| Section 504 Status | 5,297 | 12762 | 1041 | 0.918 | |
| Economic Disadvantage Status | 48,175 | 10488 | 923 | 0.912 | |
| HS | Total | 9,876 | 11920 | 1063 | 0.911 |
| EL Status | 333 | 7186 | 1299 | 0.819 | |
| IDEA Indicator | 895 | 8660 | 1253 | 0.855 | |
| Section 504 Status | 527 | 11653 | 1064 | 0.909 | |
| Economic Disadvantage Status | 2,403 | 11836 | 1087 | 0.908 |
| Grade | Group | N | Var | MSE | Rho |
|---|---|---|---|---|---|
| 3 | Total | 176,592 | 7990 | 334 | 0.958 |
| EL Status | 12,200 | 6339 | 405 | 0.936 | |
| IDEA Indicator | 12,557 | 7657 | 468 | 0.939 | |
| Section 504 Status | 2,373 | 7879 | 393 | 0.950 | |
| Economic Disadvantage Status | 46,961 | 7530 | 358 | 0.952 | |
| 4 | Total | 180,948 | 8217 | 351 | 0.957 |
| EL Status | 12,165 | 6647 | 448 | 0.933 | |
| IDEA Indicator | 13,412 | 8099 | 523 | 0.935 | |
| Section 504 Status | 2,918 | 7695 | 385 | 0.950 | |
| Economic Disadvantage Status | 48,728 | 8288 | 378 | 0.954 | |
| 5 | Total | 180,984 | 9069 | 485 | 0.946 |
| EL Status | 10,193 | 5902 | 704 | 0.881 | |
| IDEA Indicator | 12,878 | 7798 | 775 | 0.901 | |
| Section 504 Status | 3,233 | 8526 | 528 | 0.938 | |
| Economic Disadvantage Status | 49,117 | 8760 | 544 | 0.938 | |
| 6 | Total | 180,688 | 11466 | 601 | 0.948 |
| EL Status | 9,047 | 6522 | 1029 | 0.842 | |
| IDEA Indicator | 12,019 | 9764 | 1054 | 0.892 | |
| Section 504 Status | 3,426 | 10390 | 628 | 0.940 | |
| Economic Disadvantage Status | 48,016 | 10422 | 696 | 0.933 | |
| 7 | Total | 181,881 | 12536 | 708 | 0.944 |
| EL Status | 9,128 | 6676 | 1238 | 0.815 | |
| IDEA Indicator | 11,521 | 9297 | 1240 | 0.867 | |
| Section 504 Status | 3,567 | 10741 | 731 | 0.932 | |
| Economic Disadvantage Status | 47,836 | 11123 | 835 | 0.925 | |
| 8 | Total | 82,827 | 13714 | 985 | 0.928 |
| EL Status | 8,350 | 6289 | 1500 | 0.761 | |
| IDEA Indicator | 11,520 | 9554 | 1466 | 0.847 | |
| Section 504 Status | 3,882 | 13509 | 957 | 0.929 | |
| Economic Disadvantage Status | 47,893 | 11642 | 1082 | 0.907 | |
| HS | Total | 9,893 | 13412 | 949 | 0.929 |
| EL Status | 347 | 6090 | 1553 | 0.745 | |
| IDEA Indicator | 893 | 7932 | 1538 | 0.806 | |
| Section 504 Status | 529 | 14401 | 946 | 0.934 | |
| Economic Disadvantage Status | 2,414 | 11446 | 1157 | 0.899 |
2.3.3 Paper/Pencil Tests
Smarter Balanced supports fixed-form paper/pencil tests adherent to the full blueprint for use in a variety of situations, including schools that lack computer capacity and to address potential religious concerns associated with using technology for assessments. Scores on the paper/pencil tests are on the same reporting scale that is used for the online assessments. The forms used in the 2023-24 administration are collectively (for all grades) referred to as Form 6.
Table 2.9 and Table 2.10 show, for ELA/literacy and mathematics, respectively, statistical information pertaining to the items on Form 6 and to the measurement precision of the form. MSE estimates for the paper/pencil forms were based on Equation (2.5) through Equation (2.8), except that quadrature points and weights over a hypothetical theta distribution were used instead of observed scores (theta_hats). The hypothetical true score distribution used for quadrature was the student distribution from the 2021-22 operational administration. Reliability was then computed as in Equation (2.4) with the observed-score variance equal to the MSE plus the variance of the hypothetical true score distribution. Reliability was higher for the full test than for subscales and is inversely related to the SEM.
| Grade | Nitems | Rho | SEM | Avg. b | Avg. a | C1 Rho | C1 SEM | C2 Rho | C2 SEM | C3 Rho | C3 SEM | C4 Rho | C4 SEM |
|---|---|---|---|---|---|---|---|---|---|---|---|---|---|
| 3 | 39 | 0.915 | 0.358 | -1.134 | 0.670 | 0.769 | 0.644 | 0.756 | 0.668 | 0.643 | 0.875 | 0.708 | 0.753 |
| 4 | 39 | 0.919 | 0.364 | -0.640 | 0.678 | 0.803 | 0.607 | 0.732 | 0.741 | 0.673 | 0.853 | 0.696 | 0.810 |
| 5 | 39 | 0.922 | 0.364 | -0.174 | 0.663 | 0.785 | 0.657 | 0.771 | 0.683 | 0.670 | 0.880 | 0.721 | 0.781 |
| 6 | 39 | 0.905 | 0.392 | 0.361 | 0.555 | 0.774 | 0.655 | 0.748 | 0.703 | 0.563 | 1.068 | 0.596 | 0.997 |
| 7 | 39 | 0.914 | 0.398 | 0.868 | 0.564 | 0.780 | 0.686 | 0.762 | 0.723 | 0.622 | 1.007 | 0.665 | 0.917 |
| 8 | 42 | 0.925 | 0.383 | 1.050 | 0.597 | 0.787 | 0.697 | 0.770 | 0.733 | 0.701 | 0.875 | 0.687 | 0.905 |
| 11 | 40 | 0.931 | 0.411 | 1.008 | 0.580 | 0.816 | 0.714 | 0.785 | 0.788 | 0.685 | 1.019 | 0.739 | 0.895 |
| Grade | Nitems | Rho | SEM | Avg. b | Avg. a | C1 Rho | C1 SEM | C2&4 Rho | C2&4 SEM | C3 Rho | C3 SEM |
|---|---|---|---|---|---|---|---|---|---|---|---|
| 3 | 36 | 0.913 | 0.369 | -0.935 | 0.699 | 0.822 | 0.558 | 0.702 | 0.781 | 0.755 | 0.683 |
| 4 | 38 | 0.919 | 0.361 | -0.305 | 0.768 | 0.845 | 0.521 | 0.730 | 0.740 | 0.703 | 0.792 |
| 5 | 39 | 0.918 | 0.389 | -0.131 | 0.644 | 0.840 | 0.570 | 0.740 | 0.772 | 0.719 | 0.816 |
| 6 | 39 | 0.911 | 0.464 | 0.533 | 0.646 | 0.812 | 0.712 | 0.754 | 0.846 | 0.703 | 0.962 |
| 7 | 40 | 0.916 | 0.467 | 0.699 | 0.631 | 0.833 | 0.690 | 0.740 | 0.912 | 0.721 | 0.957 |
| 8 | 39 | 0.899 | 0.559 | 1.016 | 0.536 | 0.816 | 0.795 | 0.607 | 1.345 | 0.704 | 1.084 |
| 10 | 41 | 0.905 | 0.576 | 1.397 | 0.533 | 0.833 | 0.797 | 0.720 | 1.112 | 0.657 | 1.288 |
| HS | 42 | 0.887 | 0.637 | 1.805 | 0.490 | 0.817 | 0.844 | 0.615 | 1.410 | 0.615 | 1.408 |
2.4 Classification Accuracy
Information on classification accuracy is based on actual test results from the 2023-24 administration. Classification accuracy is a measure of how accurately test scores or subscores place students into reporting category levels. The likelihood of inaccurate placement depends on the amount of measurement error associated with scores, especially those nearest cut points, and on the distribution of student achievement. For this report, classification accuracy was calculated in the following manner. For each examinee, analysts used the estimated scale score and its standard error of measurement to obtain a normal approximation of the likelihood function over the range of scale scores. The normal approximation took the scale score estimate as its mean and the standard error of measurement as its standard deviation. The proportion of the area under the curve within each level was then calculated.
Figure 2.1 illustrates the approach for one examinee in grade 11 mathematics. In this example, the examinee’s overall scale score is 2606 (placing this student in level 2, based on the cut scores for this grade level), with a standard error of measurement of 31 points. Accordingly, a normal distribution with a mean of 2606 and a standard deviation of 31 was used to approximate the likelihood of the examinee’s true level, based on the observed test performance. The area under the curve was computed within each score range in order to estimate the probability that the examinee’s true score falls within that level (the red vertical lines identify the cut scores). For the student in Figure 2.1, the estimated probabilities were 2.1% for level 1, 74.0% for level 2, 23.9% for level 3, and 0.0% for level 4. Since the student’s assigned level was level 2, there is an estimated 74% chance the student was correctly classified and a 26% (2.1% + 23.9% + 0.0%) chance the student was misclassified.
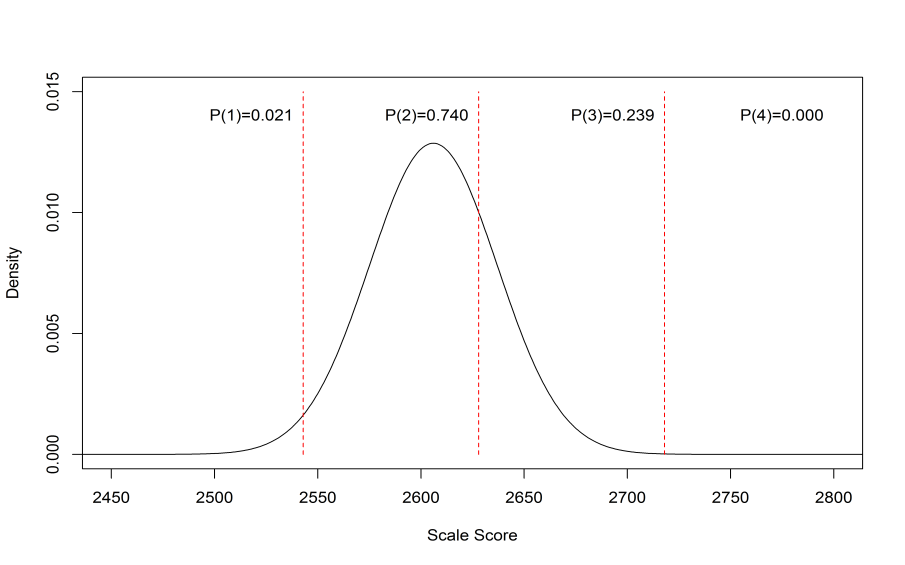
Figure 2.1: Illustrative Example of a Normal Distribution Used to Calculate Classification Accuracy
The same procedure was then applied to all students within the sample. Results are shown for 10 cases in Table 2.11 (student 6 is the case illustrated in Figure 2.1).
| Student | SS | SEM | Level | P(L1) | P(L2) | P(L3) | P(L4) |
|---|---|---|---|---|---|---|---|
| 1 | 2751 | 23 | 4 | 0.000 | 0.000 | 0.076 | 0.924 |
| 2 | 2375 | 66 | 1 | 0.995 | 0.005 | 0.000 | 0.000 |
| 3 | 2482 | 42 | 1 | 0.927 | 0.073 | 0.000 | 0.000 |
| 4 | 2529 | 37 | 1 | 0.647 | 0.349 | 0.004 | 0.000 |
| 5 | 2524 | 36 | 1 | 0.701 | 0.297 | 0.002 | 0.000 |
| 6 | 2606 | 31 | 2 | 0.021 | 0.740 | 0.239 | 0.000 |
| 7 | 2474 | 42 | 1 | 0.950 | 0.050 | 0.000 | 0.000 |
| 8 | 2657 | 26 | 3 | 0.000 | 0.132 | 0.858 | 0.009 |
| 9 | 2600 | 31 | 2 | 0.033 | 0.784 | 0.183 | 0.000 |
| 10 | 2672 | 23 | 3 | 0.000 | 0.028 | 0.949 | 0.023 |
Table 2.12 presents a hypothetical set of results for the overall score and for a claim score (claim 3) for a population of students. The number (N) and proportion (P) of students classified into each achievement level is shown in the first three columns. These are counts and proportions of “observed” classifications in the population. Students are classified into the four achievement levels by their overall score. By claim scores, students are classified as “below,” “near,” or “above” standard, where the standard is the level 3 cut score. Rules for classifying students by their claim scores are detailed in Chapter 7.
The next four columns (“Freq L1,” etc.) show the number of students by “true level” among students at a given “observed level.” The last four columns convert the frequencies by true level into proportions. The sum of proportions in the last four columns of the “Overall” section of the table equals 1.0. Likewise, the sum of proportions in the last four columns of the “Claim 3” section of the table equals 1.0. For the overall test, the proportions of correct classifications for this hypothetical example are .404, .180, .145, and .098 for levels 1-4, respectively.
| Score | Observed Level | N | P | Freq L1 | Freq L2 | Freq L3 | Freq L4 | Prop L1 | Prop L2 | Prop L3 | Prop L4 |
|---|---|---|---|---|---|---|---|---|---|---|---|
| Overall | Level 1 | 251,896 | 0.451 | 225,454 | 26,172 | 263 | 8 | 0.404 | 0.047 | 0.000 | 0.000 |
| Level 2 | 141,256 | 0.253 | 21,800 | 100,364 | 19,080 | 11 | 0.039 | 0.180 | 0.034 | 0.000 | |
| Level 3 | 104,125 | 0.186 | 161 | 14,223 | 81,089 | 8,652 | 0.000 | 0.025 | 0.145 | 0.015 | |
| Level 4 | 61,276 | 0.110 | 47 | 29 | 6,452 | 54,748 | 0.000 | 0.000 | 0.012 | 0.098 | |
| Claim 3 | Below Standard | 167,810 | 0.300 | 143,536 | 18,323 | 4,961 | 990 | 0.257 | 0.033 | 0.009 | 0.002 |
| Near Standard | 309,550 | 0.554 | 93,364 | 102,133 | 89,696 | 24,357 | 0.167 | 0.183 | 0.161 | 0.044 | |
| Above Standard | 81,193 | 0.145 | 94 | 1,214 | 18,949 | 60,936 | 0.000 | 0.002 | 0.034 | 0.109 |
For claim scores, correct “below” classifications are represented in cells corresponding to the “below standard” row and the levels 1 and 2 columns. Both levels 1 and 2 are below the level 3 cut score, which is the standard. Similarly, correct “above” standard classifications are represented in cells corresponding to the “above standard” row and the levels 3 and 4 columns. Correct classifications for “near” standard are not computed. There is no absolute criterion or scale score range, such as is defined by cut scores, for determining whether a student is truly at or near the standard. That is, the standard (level 3 cut score) clearly defines whether a student is above or below standard, but there is no range centered on the standard for determining whether a student is “near.”
Table 2.13 shows more specifically how the proportion of correct classifications is computed for classifications based on students’ overall and claim scores. For each type of score (overall and claim), the proportion of correct classifications is computed overall and conditionally on each observed classification (except for the “near standard” claim score classification). The conditional proportion correct is the proportion correct within a row divided by the total proportion within a row. For the overall score, the overall proportion correct is the sum of the proportions correct within the overall table section.
| Score | Observed Level | P | Prop L1 | Prop L2 | Prop L3 | Prop L4 | Accuracy by level | Accuracy overall |
|---|---|---|---|---|---|---|---|---|
| Overall | Level 1 | 0.451 | 0.404 | 0.047 | 0.000 | 0.000 | .404/.451=.895 | (.404+.180+.145+.098)/1.000=.827 |
| Level 2 | 0.253 | 0.039 | 0.180 | 0.034 | 0.000 | .180/.253=.711 | ||
| Level 3 | 0.186 | 0.000 | 0.025 | 0.145 | 0.015 | .145/.186=.779 | ||
| Level 4 | 0.110 | 0.000 | 0.000 | 0.012 | 0.098 | .098/.110=.893 | ||
| Claim 3 | Below Standard | 0.300 | 0.257 | 0.033 | 0.009 | 0.002 | (.257+.033)/.300=.965 | (.257+.033+.034+.109)/(.300+.145)=.971 |
| Near Standard | 0.554 | 0.167 | 0.183 | 0.161 | 0.044 | NA | ||
| Above Standard | 0.145 | 0.000 | 0.002 | 0.034 | 0.109 | (.034+.109)/.145=.984 |
For the claim score, the overall classification accuracy rate is based only on students whose observed achievement is “below standard” or “above standard.” That is, the overall proportion correct for classifications by claim scores is the sum of the proportions correct in the claim section of the table, divided by the sum of all of the proportions in the “above standard” and “below standard” rows.
The following two sections show classification accuracy statistics for ELA/literacy and mathematics. There are seven tables in each section—one for each grade 3-8 and high school (HS). The statistics in these tables were computed as described above.
2.4.1 English Language Arts/Literacy
Results in this section are based on real data from students who took the full blueprint. Table 2.14 through Table 2.20 show ELA/literacy classification accuracy for each grade 3-8 and high school (HS). Section 2.4 explains how the statistics in these tables were computed. Classification accuracy for each category was high to moderately high for all ELA/literacy grades.
| Score | Observed Level | N | P | True L1 | True L2 | True L3 | True L4 | Accuracy by Level | Accuracy Overall |
|---|---|---|---|---|---|---|---|---|---|
| Overall | Level 1 | 60,373 | 0.342 | 0.313 | 0.029 | 0.000 | 0.000 | 0.916 | 0.821 |
| Level 2 | 42,560 | 0.241 | 0.032 | 0.178 | 0.031 | 0.000 | 0.738 | ||
| Level 3 | 37,577 | 0.213 | 0.000 | 0.033 | 0.151 | 0.029 | 0.711 | ||
| Level 4 | 35,898 | 0.203 | 0.000 | 0.000 | 0.025 | 0.178 | 0.875 | ||
| Claim 1 | Below | 27,533 | 0.349 | 0.281 | 0.063 | 0.005 | 0.000 | 0.985 | 0.981 |
| Near | 32,478 | 0.412 | 0.047 | 0.166 | 0.150 | 0.048 | NA | ||
| Above | 18,809 | 0.239 | 0.000 | 0.005 | 0.053 | 0.180 | 0.977 | ||
| Claim 2 | Below | 18,340 | 0.413 | 0.289 | 0.095 | 0.025 | 0.004 | 0.930 | 0.939 |
| Near | 17,457 | 0.393 | 0.045 | 0.139 | 0.142 | 0.067 | NA | ||
| Above | 8,567 | 0.193 | 0.000 | 0.010 | 0.047 | 0.136 | 0.948 | ||
| Claim 3 | Below | 10,389 | 0.132 | 0.115 | 0.014 | 0.002 | 0.000 | 0.980 | 0.944 |
| Near | 52,559 | 0.667 | 0.211 | 0.204 | 0.157 | 0.094 | NA | ||
| Above | 15,873 | 0.201 | 0.002 | 0.016 | 0.049 | 0.134 | 0.909 | ||
| Claim 4 | Below | 14,940 | 0.337 | 0.271 | 0.058 | 0.007 | 0.000 | 0.978 | 0.971 |
| Near | 20,136 | 0.454 | 0.063 | 0.179 | 0.161 | 0.052 | NA | ||
| Above | 9,288 | 0.209 | 0.000 | 0.007 | 0.046 | 0.155 | 0.964 | ||
| Total: | All Students | 176,408 | 1.000 | NA | NA | NA | NA | NA | NA |
| Score | Observed Level | N | P | True L1 | True L2 | True L3 | True L4 | Accuracy by Level | Accuracy Overall |
|---|---|---|---|---|---|---|---|---|---|
| Overall | Level 1 | 65,786 | 0.364 | 0.335 | 0.029 | 0.000 | 0.000 | 0.920 | 0.815 |
| Level 2 | 33,930 | 0.188 | 0.031 | 0.127 | 0.030 | 0.000 | 0.677 | ||
| Level 3 | 39,692 | 0.219 | 0.000 | 0.034 | 0.153 | 0.032 | 0.699 | ||
| Level 4 | 41,443 | 0.229 | 0.000 | 0.000 | 0.029 | 0.200 | 0.874 | ||
| Claim 1 | Below | 27,394 | 0.335 | 0.290 | 0.041 | 0.004 | 0.000 | 0.986 | 0.984 |
| Near | 34,448 | 0.421 | 0.063 | 0.140 | 0.159 | 0.060 | NA | ||
| Above | 19,986 | 0.244 | 0.000 | 0.004 | 0.046 | 0.194 | 0.982 | ||
| Claim 2 | Below | 17,799 | 0.390 | 0.303 | 0.063 | 0.020 | 0.003 | 0.940 | 0.937 |
| Near | 18,409 | 0.403 | 0.062 | 0.117 | 0.143 | 0.082 | NA | ||
| Above | 9,450 | 0.207 | 0.002 | 0.012 | 0.050 | 0.143 | 0.933 | ||
| Claim 3 | Below | 16,973 | 0.207 | 0.182 | 0.020 | 0.005 | 0.001 | 0.975 | 0.954 |
| Near | 46,511 | 0.568 | 0.167 | 0.153 | 0.154 | 0.094 | NA | ||
| Above | 18,346 | 0.224 | 0.003 | 0.012 | 0.050 | 0.159 | 0.933 | ||
| Claim 4 | Below | 14,898 | 0.326 | 0.268 | 0.047 | 0.010 | 0.001 | 0.966 | 0.969 |
| Near | 21,142 | 0.463 | 0.098 | 0.140 | 0.158 | 0.067 | NA | ||
| Above | 9,618 | 0.211 | 0.001 | 0.005 | 0.045 | 0.160 | 0.971 | ||
| Total: | All Students | 180,851 | 1.000 | NA | NA | NA | NA | NA | NA |
| Score | Observed Level | N | P | True L1 | True L2 | True L3 | True L4 | Accuracy by Level | Accuracy Overall |
|---|---|---|---|---|---|---|---|---|---|
| Overall | Level 1 | 60,852 | 0.336 | 0.310 | 0.027 | 0.000 | 0.000 | 0.921 | 0.826 |
| Level 2 | 36,430 | 0.201 | 0.030 | 0.143 | 0.029 | 0.000 | 0.709 | ||
| Level 3 | 48,840 | 0.270 | 0.000 | 0.031 | 0.209 | 0.030 | 0.773 | ||
| Level 4 | 34,818 | 0.192 | 0.000 | 0.000 | 0.028 | 0.164 | 0.855 | ||
| Claim 1 | Below | 26,719 | 0.324 | 0.274 | 0.045 | 0.004 | 0.000 | 0.986 | 0.984 |
| Near | 34,195 | 0.414 | 0.049 | 0.145 | 0.183 | 0.038 | NA | ||
| Above | 21,654 | 0.262 | 0.000 | 0.005 | 0.076 | 0.181 | 0.982 | ||
| Claim 2 | Below | 17,048 | 0.370 | 0.277 | 0.071 | 0.021 | 0.001 | 0.940 | 0.945 |
| Near | 18,892 | 0.410 | 0.055 | 0.126 | 0.177 | 0.051 | NA | ||
| Above | 10,179 | 0.221 | 0.001 | 0.010 | 0.073 | 0.137 | 0.950 | ||
| Claim 3 | Below | 16,788 | 0.203 | 0.178 | 0.021 | 0.005 | 0.000 | 0.974 | 0.953 |
| Near | 47,221 | 0.572 | 0.142 | 0.162 | 0.191 | 0.077 | NA | ||
| Above | 18,560 | 0.225 | 0.003 | 0.013 | 0.068 | 0.142 | 0.932 | ||
| Claim 4 | Below | 7,313 | 0.159 | 0.141 | 0.015 | 0.002 | 0.000 | 0.985 | 0.981 |
| Near | 28,528 | 0.619 | 0.192 | 0.186 | 0.199 | 0.041 | NA | ||
| Above | 10,278 | 0.223 | 0.000 | 0.005 | 0.069 | 0.148 | 0.976 | ||
| Total: | All Students | 180,940 | 1.000 | NA | NA | NA | NA | NA | NA |
| Score | Observed Level | N | P | True L1 | True L2 | True L3 | True L4 | Accuracy by Level | Accuracy Overall |
|---|---|---|---|---|---|---|---|---|---|
| Overall | Level 1 | 62,429 | 0.345 | 0.314 | 0.031 | 0.000 | 0.000 | 0.910 | 0.824 |
| Level 2 | 45,034 | 0.249 | 0.033 | 0.185 | 0.031 | 0.000 | 0.745 | ||
| Level 3 | 49,272 | 0.272 | 0.000 | 0.033 | 0.213 | 0.027 | 0.782 | ||
| Level 4 | 24,082 | 0.133 | 0.000 | 0.000 | 0.022 | 0.112 | 0.838 | ||
| Claim 1 | Below | 27,757 | 0.338 | 0.269 | 0.064 | 0.005 | 0.000 | 0.986 | 0.982 |
| Near | 36,937 | 0.450 | 0.051 | 0.174 | 0.191 | 0.034 | NA | ||
| Above | 17,422 | 0.212 | 0.000 | 0.005 | 0.073 | 0.135 | 0.978 | ||
| Claim 2 | Below | 20,174 | 0.442 | 0.308 | 0.106 | 0.026 | 0.001 | 0.937 | 0.937 |
| Near | 16,884 | 0.370 | 0.037 | 0.133 | 0.164 | 0.036 | NA | ||
| Above | 8,588 | 0.188 | 0.001 | 0.011 | 0.071 | 0.105 | 0.936 | ||
| Claim 3 | Below | 21,195 | 0.258 | 0.214 | 0.039 | 0.006 | 0.000 | 0.977 | 0.953 |
| Near | 46,207 | 0.563 | 0.105 | 0.193 | 0.196 | 0.069 | NA | ||
| Above | 14,718 | 0.179 | 0.001 | 0.011 | 0.067 | 0.099 | 0.929 | ||
| Claim 4 | Below | 13,936 | 0.305 | 0.252 | 0.049 | 0.005 | 0.000 | 0.985 | 0.958 |
| Near | 20,910 | 0.458 | 0.092 | 0.187 | 0.156 | 0.022 | NA | ||
| Above | 10,800 | 0.237 | 0.001 | 0.015 | 0.100 | 0.120 | 0.932 | ||
| Total: | All Students | 180,817 | 1.000 | NA | NA | NA | NA | NA | NA |
| Score | Observed Level | N | P | True L1 | True L2 | True L3 | True L4 | Accuracy by Level | Accuracy Overall |
|---|---|---|---|---|---|---|---|---|---|
| Overall | Level 1 | 60,066 | 0.330 | 0.299 | 0.030 | 0.000 | 0.000 | 0.908 | 0.819 |
| Level 2 | 45,761 | 0.251 | 0.034 | 0.183 | 0.035 | 0.000 | 0.727 | ||
| Level 3 | 54,327 | 0.298 | 0.000 | 0.036 | 0.236 | 0.026 | 0.791 | ||
| Level 4 | 21,948 | 0.121 | 0.000 | 0.000 | 0.020 | 0.101 | 0.835 | ||
| Claim 1 | Below | 24,918 | 0.302 | 0.248 | 0.050 | 0.004 | 0.000 | 0.987 | 0.982 |
| Near | 37,405 | 0.454 | 0.057 | 0.178 | 0.198 | 0.020 | NA | ||
| Above | 20,154 | 0.244 | 0.000 | 0.006 | 0.102 | 0.136 | 0.977 | ||
| Claim 2 | Below | 16,269 | 0.355 | 0.263 | 0.077 | 0.015 | 0.000 | 0.956 | 0.949 |
| Near | 19,344 | 0.422 | 0.054 | 0.157 | 0.185 | 0.026 | NA | ||
| Above | 10,181 | 0.222 | 0.001 | 0.012 | 0.100 | 0.110 | 0.942 | ||
| Claim 3 | Below | 20,861 | 0.253 | 0.206 | 0.039 | 0.008 | 0.000 | 0.969 | 0.961 |
| Near | 48,839 | 0.592 | 0.099 | 0.188 | 0.241 | 0.064 | NA | ||
| Above | 12,782 | 0.155 | 0.000 | 0.007 | 0.055 | 0.092 | 0.953 | ||
| Claim 4 | Below | 11,334 | 0.247 | 0.202 | 0.040 | 0.006 | 0.000 | 0.977 | 0.963 |
| Near | 24,531 | 0.536 | 0.115 | 0.196 | 0.202 | 0.024 | NA | ||
| Above | 9,929 | 0.217 | 0.001 | 0.010 | 0.093 | 0.113 | 0.948 | ||
| Total: | All Students | 182,102 | 1.000 | NA | NA | NA | NA | NA | NA |
| Score | Observed Level | N | P | True L1 | True L2 | True L3 | True L4 | Accuracy by Level | Accuracy Overall |
|---|---|---|---|---|---|---|---|---|---|
| Overall | Level 1 | 25,630 | 0.308 | 0.276 | 0.031 | 0.000 | 0.000 | 0.898 | 0.808 |
| Level 2 | 20,759 | 0.249 | 0.034 | 0.180 | 0.035 | 0.000 | 0.723 | ||
| Level 3 | 25,865 | 0.310 | 0.000 | 0.040 | 0.242 | 0.029 | 0.778 | ||
| Level 4 | 11,051 | 0.133 | 0.000 | 0.000 | 0.023 | 0.110 | 0.830 | ||
| Claim 1 | Below | 27,166 | 0.327 | 0.263 | 0.060 | 0.004 | 0.000 | 0.989 | 0.984 |
| Near | 37,399 | 0.450 | 0.046 | 0.186 | 0.200 | 0.018 | NA | ||
| Above | 18,551 | 0.223 | 0.000 | 0.005 | 0.097 | 0.122 | 0.979 | ||
| Claim 2 | Below | 20,279 | 0.440 | 0.295 | 0.117 | 0.027 | 0.001 | 0.938 | 0.943 |
| Near | 18,488 | 0.401 | 0.036 | 0.141 | 0.192 | 0.032 | NA | ||
| Above | 7,324 | 0.159 | 0.001 | 0.008 | 0.070 | 0.081 | 0.948 | ||
| Claim 3 | Below | 20,676 | 0.249 | 0.199 | 0.042 | 0.007 | 0.000 | 0.970 | 0.951 |
| Near | 46,601 | 0.561 | 0.109 | 0.197 | 0.213 | 0.042 | NA | ||
| Above | 15,844 | 0.191 | 0.001 | 0.012 | 0.080 | 0.097 | 0.931 | ||
| Claim 4 | Below | 11,028 | 0.239 | 0.198 | 0.038 | 0.003 | 0.000 | 0.985 | 0.969 |
| Near | 26,642 | 0.578 | 0.133 | 0.221 | 0.203 | 0.022 | NA | ||
| Above | 8,421 | 0.183 | 0.001 | 0.008 | 0.083 | 0.091 | 0.952 | ||
| Total: | All Students | 83,305 | 1.000 | NA | NA | NA | NA | NA | NA |
| Score | Observed Level | N | P | True L1 | True L2 | True L3 | True L4 | Accuracy by Level | Accuracy Overall |
|---|---|---|---|---|---|---|---|---|---|
| Overall | Level 1 | 1,657 | 0.168 | 0.148 | 0.020 | 0.000 | 0.000 | 0.879 | 0.795 |
| Level 2 | 2,066 | 0.209 | 0.026 | 0.152 | 0.032 | 0.000 | 0.726 | ||
| Level 3 | 3,524 | 0.357 | 0.000 | 0.042 | 0.269 | 0.046 | 0.754 | ||
| Level 4 | 2,629 | 0.266 | 0.000 | 0.000 | 0.040 | 0.226 | 0.851 | ||
| Claim 1 | Below | 2,046 | 0.207 | 0.141 | 0.060 | 0.006 | 0.000 | 0.969 | 0.977 |
| Near | 4,483 | 0.454 | 0.032 | 0.149 | 0.229 | 0.044 | NA | ||
| Above | 3,346 | 0.339 | 0.000 | 0.005 | 0.106 | 0.228 | 0.985 | ||
| Claim 2 | Below | 1,721 | 0.174 | 0.124 | 0.042 | 0.008 | 0.000 | 0.950 | 0.960 |
| Near | 5,036 | 0.510 | 0.049 | 0.163 | 0.230 | 0.068 | NA | ||
| Above | 3,118 | 0.316 | 0.000 | 0.009 | 0.102 | 0.204 | 0.970 | ||
| Claim 3 | Below | 1,597 | 0.162 | 0.114 | 0.039 | 0.008 | 0.001 | 0.947 | 0.961 |
| Near | 6,078 | 0.615 | 0.059 | 0.170 | 0.272 | 0.115 | NA | ||
| Above | 2,200 | 0.223 | 0.000 | 0.005 | 0.061 | 0.156 | 0.975 | ||
| Claim 4 | Below | 1,639 | 0.166 | 0.122 | 0.040 | 0.003 | 0.000 | 0.980 | 0.978 |
| Near | 5,121 | 0.519 | 0.051 | 0.167 | 0.238 | 0.063 | NA | ||
| Above | 3,115 | 0.315 | 0.000 | 0.007 | 0.099 | 0.209 | 0.977 | ||
| Total: | All Students | 9,876 | 1.000 | NA | NA | NA | NA | NA | NA |
2.4.2 Mathematics
Results in this section are based on real data from students who took the full blueprint. Table 2.21 through Table 2.27 show the classification accuracy of the mathematics assessment for each grade 3-8 and high school (HS). Section 2.4 explains how the statistics in these tables were computed. Classification accuracy for each category was high to moderately high for all mathematics grades.
| Score | Observed Level | N | P | True L1 | True L2 | True L3 | True L4 | Accuracy by Level | Accuracy Overall |
|---|---|---|---|---|---|---|---|---|---|
| Overall | Level 1 | 57,630 | 0.326 | 0.302 | 0.024 | 0.000 | 0.000 | 0.927 | 0.855 |
| Level 2 | 39,482 | 0.224 | 0.027 | 0.171 | 0.026 | 0.000 | 0.765 | ||
| Level 3 | 44,935 | 0.254 | 0.000 | 0.027 | 0.206 | 0.021 | 0.808 | ||
| Level 4 | 34,545 | 0.196 | 0.000 | 0.000 | 0.020 | 0.176 | 0.899 | ||
| Claim 1 | Below | 29,272 | 0.371 | 0.277 | 0.074 | 0.018 | 0.002 | 0.947 | 0.927 |
| Near | 22,038 | 0.280 | 0.040 | 0.113 | 0.112 | 0.014 | NA | ||
| Above | 27,498 | 0.349 | 0.008 | 0.024 | 0.120 | 0.197 | 0.908 | ||
| Claim 2/4 | Below | 12,367 | 0.276 | 0.219 | 0.052 | 0.005 | 0.000 | 0.981 | 0.982 |
| Near | 19,322 | 0.431 | 0.052 | 0.157 | 0.184 | 0.039 | NA | ||
| Above | 13,136 | 0.293 | 0.000 | 0.005 | 0.078 | 0.210 | 0.982 | ||
| Claim 3 | Below | 17,712 | 0.225 | 0.185 | 0.036 | 0.004 | 0.000 | 0.982 | 0.955 |
| Near | 38,586 | 0.490 | 0.137 | 0.159 | 0.160 | 0.034 | NA | ||
| Above | 22,510 | 0.286 | 0.004 | 0.017 | 0.086 | 0.179 | 0.928 | ||
| Total: | All Students | 176,592 | 1.000 | NA | NA | NA | NA | NA | NA |
| Score | Observed Level | N | P | True L1 | True L2 | True L3 | True L4 | Accuracy by Level | Accuracy Overall |
|---|---|---|---|---|---|---|---|---|---|
| Overall | Level 1 | 53,228 | 0.294 | 0.271 | 0.024 | 0.000 | 0.000 | 0.920 | 0.861 |
| Level 2 | 51,721 | 0.286 | 0.026 | 0.235 | 0.025 | 0.000 | 0.822 | ||
| Level 3 | 43,757 | 0.242 | 0.000 | 0.027 | 0.196 | 0.020 | 0.809 | ||
| Level 4 | 32,242 | 0.178 | 0.000 | 0.000 | 0.018 | 0.160 | 0.898 | ||
| Claim 1 | Below | 33,645 | 0.412 | 0.269 | 0.117 | 0.023 | 0.004 | 0.936 | 0.926 |
| Near | 21,031 | 0.257 | 0.019 | 0.119 | 0.105 | 0.014 | NA | ||
| Above | 27,065 | 0.331 | 0.005 | 0.023 | 0.111 | 0.192 | 0.916 | ||
| Claim 2/4 | Below | 14,798 | 0.316 | 0.220 | 0.090 | 0.007 | 0.000 | 0.979 | 0.983 |
| Near | 20,055 | 0.428 | 0.023 | 0.174 | 0.186 | 0.046 | NA | ||
| Above | 11,951 | 0.255 | 0.000 | 0.003 | 0.059 | 0.193 | 0.987 | ||
| Claim 3 | Below | 15,705 | 0.192 | 0.138 | 0.051 | 0.003 | 0.000 | 0.981 | 0.962 |
| Near | 44,712 | 0.547 | 0.153 | 0.195 | 0.162 | 0.037 | NA | ||
| Above | 21,324 | 0.261 | 0.002 | 0.013 | 0.073 | 0.173 | 0.943 | ||
| Total: | All Students | 180,948 | 1.000 | NA | NA | NA | NA | NA | NA |
| Score | Observed Level | N | P | True L1 | True L2 | True L3 | True L4 | Accuracy by Level | Accuracy Overall |
|---|---|---|---|---|---|---|---|---|---|
| Overall | Level 1 | 69,850 | 0.386 | 0.356 | 0.030 | 0.000 | 0.000 | 0.923 | 0.856 |
| Level 2 | 45,798 | 0.253 | 0.027 | 0.201 | 0.025 | 0.000 | 0.795 | ||
| Level 3 | 31,318 | 0.173 | 0.000 | 0.024 | 0.130 | 0.020 | 0.749 | ||
| Level 4 | 34,018 | 0.188 | 0.000 | 0.000 | 0.019 | 0.169 | 0.897 | ||
| Claim 1 | Below | 38,429 | 0.466 | 0.324 | 0.111 | 0.024 | 0.008 | 0.933 | 0.930 |
| Near | 21,593 | 0.262 | 0.023 | 0.121 | 0.090 | 0.027 | NA | ||
| Above | 22,432 | 0.272 | 0.003 | 0.017 | 0.065 | 0.187 | 0.926 | ||
| Claim 2/4 | Below | 16,068 | 0.342 | 0.266 | 0.069 | 0.006 | 0.000 | 0.982 | 0.983 |
| Near | 20,907 | 0.444 | 0.059 | 0.175 | 0.145 | 0.065 | NA | ||
| Above | 10,061 | 0.214 | 0.000 | 0.003 | 0.033 | 0.178 | 0.984 | ||
| Claim 3 | Below | 24,845 | 0.301 | 0.239 | 0.056 | 0.006 | 0.001 | 0.976 | 0.962 |
| Near | 41,909 | 0.508 | 0.111 | 0.185 | 0.138 | 0.075 | NA | ||
| Above | 15,700 | 0.190 | 0.001 | 0.009 | 0.035 | 0.146 | 0.948 | ||
| Total: | All Students | 180,984 | 1.000 | NA | NA | NA | NA | NA | NA |
| Score | Observed Level | N | P | True L1 | True L2 | True L3 | True L4 | Accuracy by Level | Accuracy Overall |
|---|---|---|---|---|---|---|---|---|---|
| Overall | Level 1 | 69,555 | 0.385 | 0.357 | 0.028 | 0.000 | 0.000 | 0.927 | 0.852 |
| Level 2 | 49,560 | 0.274 | 0.029 | 0.218 | 0.027 | 0.000 | 0.796 | ||
| Level 3 | 32,787 | 0.181 | 0.000 | 0.026 | 0.135 | 0.021 | 0.745 | ||
| Level 4 | 28,786 | 0.159 | 0.000 | 0.000 | 0.017 | 0.142 | 0.892 | ||
| Claim 1 | Below | 39,378 | 0.481 | 0.340 | 0.117 | 0.019 | 0.004 | 0.951 | 0.940 |
| Near | 22,832 | 0.279 | 0.024 | 0.128 | 0.099 | 0.029 | NA | ||
| Above | 19,659 | 0.240 | 0.002 | 0.015 | 0.062 | 0.161 | 0.929 | ||
| Claim 2/4 | Below | 16,758 | 0.358 | 0.279 | 0.073 | 0.006 | 0.000 | 0.984 | 0.982 |
| Near | 20,388 | 0.435 | 0.046 | 0.184 | 0.149 | 0.056 | NA | ||
| Above | 9,723 | 0.207 | 0.000 | 0.004 | 0.037 | 0.166 | 0.980 | ||
| Claim 3 | Below | 21,228 | 0.259 | 0.205 | 0.048 | 0.005 | 0.001 | 0.977 | 0.969 |
| Near | 46,904 | 0.573 | 0.161 | 0.205 | 0.142 | 0.065 | NA | ||
| Above | 13,737 | 0.168 | 0.000 | 0.006 | 0.033 | 0.128 | 0.961 | ||
| Total: | All Students | 180,688 | 1.000 | NA | NA | NA | NA | NA | NA |
| Score | Observed Level | N | P | True L1 | True L2 | True L3 | True L4 | Accuracy by Level | Accuracy Overall |
|---|---|---|---|---|---|---|---|---|---|
| Overall | Level 1 | 70,907 | 0.390 | 0.359 | 0.031 | 0.000 | 0.000 | 0.921 | 0.856 |
| Level 2 | 46,248 | 0.254 | 0.029 | 0.200 | 0.026 | 0.000 | 0.785 | ||
| Level 3 | 35,790 | 0.197 | 0.000 | 0.023 | 0.154 | 0.019 | 0.785 | ||
| Level 4 | 28,936 | 0.159 | 0.000 | 0.000 | 0.016 | 0.143 | 0.898 | ||
| Claim 1 | Below | 41,268 | 0.502 | 0.327 | 0.134 | 0.034 | 0.007 | 0.919 | 0.929 |
| Near | 20,048 | 0.244 | 0.015 | 0.112 | 0.098 | 0.019 | NA | ||
| Above | 20,926 | 0.254 | 0.002 | 0.013 | 0.073 | 0.166 | 0.940 | ||
| Claim 2/4 | Below | 16,423 | 0.349 | 0.286 | 0.058 | 0.005 | 0.000 | 0.987 | 0.984 |
| Near | 20,392 | 0.433 | 0.053 | 0.182 | 0.154 | 0.044 | NA | ||
| Above | 10,282 | 0.218 | 0.000 | 0.004 | 0.043 | 0.171 | 0.981 | ||
| Claim 3 | Below | 18,662 | 0.227 | 0.184 | 0.038 | 0.004 | 0.001 | 0.980 | 0.968 |
| Near | 48,767 | 0.593 | 0.159 | 0.214 | 0.160 | 0.060 | NA | ||
| Above | 14,813 | 0.180 | 0.001 | 0.007 | 0.040 | 0.132 | 0.957 | ||
| Total: | All Students | 181,881 | 1.000 | NA | NA | NA | NA | NA | NA |
| Score | Observed Level | N | P | True L1 | True L2 | True L3 | True L4 | Accuracy by Level | Accuracy Overall |
|---|---|---|---|---|---|---|---|---|---|
| Overall | Level 1 | 33,064 | 0.399 | 0.361 | 0.038 | 0.000 | 0.000 | 0.904 | 0.824 |
| Level 2 | 20,199 | 0.244 | 0.034 | 0.177 | 0.033 | 0.000 | 0.724 | ||
| Level 3 | 15,085 | 0.182 | 0.000 | 0.029 | 0.129 | 0.024 | 0.711 | ||
| Level 4 | 14,479 | 0.175 | 0.000 | 0.000 | 0.018 | 0.157 | 0.897 | ||
| Claim 1 | Below | 43,513 | 0.526 | 0.369 | 0.119 | 0.031 | 0.007 | 0.928 | 0.939 |
| Near | 21,621 | 0.261 | 0.024 | 0.116 | 0.096 | 0.025 | NA | ||
| Above | 17,602 | 0.213 | 0.001 | 0.009 | 0.053 | 0.149 | 0.949 | ||
| Claim 2/4 | Below | 15,012 | 0.316 | 0.269 | 0.044 | 0.004 | 0.000 | 0.988 | 0.983 |
| Near | 22,282 | 0.470 | 0.117 | 0.175 | 0.133 | 0.044 | NA | ||
| Above | 10,162 | 0.214 | 0.000 | 0.005 | 0.039 | 0.171 | 0.979 | ||
| Claim 3 | Below | 18,782 | 0.227 | 0.186 | 0.035 | 0.005 | 0.001 | 0.974 | 0.959 |
| Near | 50,305 | 0.608 | 0.208 | 0.201 | 0.142 | 0.058 | NA | ||
| Above | 13,649 | 0.165 | 0.001 | 0.008 | 0.034 | 0.122 | 0.945 | ||
| Total: | All Students | 82,827 | 1.000 | NA | NA | NA | NA | NA | NA |
| Score | Observed Level | N | P | True L1 | True L2 | True L3 | True L4 | Accuracy by Level | Accuracy Overall |
|---|---|---|---|---|---|---|---|---|---|
| Overall | Level 1 | 3,753 | 0.379 | 0.343 | 0.036 | 0.000 | 0.000 | 0.905 | 0.829 |
| Level 2 | 2,705 | 0.273 | 0.037 | 0.201 | 0.035 | 0.000 | 0.734 | ||
| Level 3 | 2,183 | 0.221 | 0.000 | 0.029 | 0.173 | 0.019 | 0.784 | ||
| Level 4 | 1,252 | 0.127 | 0.000 | 0.000 | 0.015 | 0.111 | 0.881 | ||
| Claim 1 | Below | 4,746 | 0.480 | 0.365 | 0.109 | 0.006 | 0.000 | 0.988 | 0.988 |
| Near | 3,065 | 0.310 | 0.016 | 0.154 | 0.135 | 0.005 | NA | ||
| Above | 2,082 | 0.210 | 0.000 | 0.002 | 0.083 | 0.125 | 0.988 | ||
| Claim 2/4 | Below | 2,928 | 0.296 | 0.252 | 0.042 | 0.003 | 0.000 | 0.991 | 0.970 |
| Near | 4,991 | 0.504 | 0.128 | 0.214 | 0.144 | 0.018 | NA | ||
| Above | 1,974 | 0.200 | 0.000 | 0.010 | 0.077 | 0.112 | 0.948 | ||
| Claim 3 | Below | 3,520 | 0.356 | 0.283 | 0.068 | 0.005 | 0.000 | 0.986 | 0.977 |
| Near | 4,863 | 0.492 | 0.098 | 0.193 | 0.170 | 0.031 | NA | ||
| Above | 1,510 | 0.153 | 0.000 | 0.005 | 0.048 | 0.100 | 0.969 | ||
| Total: | All Students | 9,893 | 1.000 | NA | NA | NA | NA | NA | NA |
2.5 Standard Errors of Measurement (SEMs)
The standard error of measurement (SEM) information in this section is based on student scores and associated SEMs included in the data Smarter Balanced received from members after the 2021-22 administration. Student scores and SEMs are not computed directly by Smarter Balanced. They are computed by service providers who deliver the test according to the scoring specifications provided by Smarter Balanced. These include the use of Equation (2.7) in this chapter for computing SEMs. According to this equation, and the adaptive nature of the test, different students receive different items. The amount of measurement error will therefore vary from student to student, even among students with the same estimate of achievement.
All of the SEM statistics reported in this chapter are based on the full blueprint and are in the reporting scale metric. For member data that includes SEMs in the theta metric exclusively, the SEMs are transformed to the reporting metric using the multiplication factors in the theta-to-scale-score transformation given in Chapter 5. Please remember that ELA/literacy and mathematics are not in the same metric and keep in mind that due to different schools’ responses to post-pandemic test administration in 2023-24, data used for SEMs analyses should not be considered as representative of the whole population.
Table 2.28 and Table 2.29 show the trend in the SEM by student decile for ELA/literacy and mathematics, respectively. Deciles were defined by ranking students from highest to lowest scale score and dividing the students into 10 equal-sized groups according to rank. Decile 1 contains the 10% of students with the lowest scale scores. Decile 10 contains the 10% of students with the highest scale scores. The SEM reported for a decile is the average SEM among examinees at that decile.
| Grade | Mean | d1 | d2 | d3 | d4 | d5 | d6 | d7 | d8 | d9 | d10 |
|---|---|---|---|---|---|---|---|---|---|---|---|
| 3 | 22.5 | 27.9 | 22.2 | 21.6 | 21.5 | 21.5 | 21.5 | 21.3 | 21.4 | 21.9 | 23.7 |
| 4 | 24.4 | 29.9 | 24.7 | 23.4 | 23.2 | 23.2 | 23.1 | 22.9 | 23.0 | 23.4 | 26.4 |
| 5 | 23.7 | 28.3 | 22.8 | 21.7 | 21.8 | 22.1 | 22.3 | 22.6 | 23.5 | 24.7 | 27.1 |
| 6 | 25.4 | 31.5 | 25.8 | 23.9 | 23.3 | 23.6 | 23.9 | 24.1 | 24.3 | 25.1 | 27.9 |
| 7 | 27.2 | 35.6 | 28.3 | 26.3 | 25.4 | 25.1 | 25.2 | 25.6 | 25.9 | 26.4 | 28.1 |
| 8 | 30.1 | 39.9 | 30.7 | 28.6 | 27.8 | 27.9 | 28.0 | 28.1 | 28.4 | 29.3 | 31.9 |
| HS | 32.4 | 39.1 | 32.1 | 30.8 | 30.6 | 30.6 | 30.8 | 31.1 | 31.3 | 32.1 | 34.0 |
| Grade | Mean | d1 | d2 | d3 | d4 | d5 | d6 | d7 | d8 | d9 | d10 |
|---|---|---|---|---|---|---|---|---|---|---|---|
| 3 | 17.7 | 25.1 | 19.1 | 17.6 | 16.7 | 16.2 | 16.0 | 15.8 | 15.8 | 16.0 | 17.8 |
| 4 | 17.9 | 27.7 | 20.2 | 18.0 | 16.8 | 16.4 | 16.2 | 15.8 | 15.3 | 15.3 | 16.9 |
| 5 | 21.1 | 32.9 | 26.6 | 24.0 | 21.7 | 19.5 | 18.2 | 17.0 | 16.0 | 16.3 | 17.6 |
| 6 | 23.2 | 38.9 | 28.6 | 24.9 | 23.1 | 21.1 | 20.4 | 19.8 | 18.7 | 17.9 | 18.7 |
| 7 | 24.9 | 43.6 | 31.9 | 27.4 | 25.4 | 23.3 | 21.9 | 20.5 | 18.6 | 17.9 | 18.4 |
| 8 | 30.3 | 44.7 | 37.2 | 34.0 | 31.9 | 29.8 | 28.0 | 26.2 | 24.3 | 22.8 | 23.4 |
| HS | 30.0 | 44.8 | 36.0 | 32.7 | 30.6 | 29.1 | 28.0 | 26.4 | 24.7 | 23.3 | 23.8 |
Table 2.30 and Table 2.31 show the average SEM near the achievement level cut scores. In the table, M is Mean and SD is Standard Deviation.
The average SEM reported for a given cut score is the average SEM among students within 10 scale score units of the cut score. In the column headings, “Cut1” is the lowest cut score defining the lower boundary of level 2, “Cut2” defines the lower boundary of level 3, and “Cut3” defines the lower boundary of level 4.
| Grade | Cut1v2_N | Cut1v2_M | Cut1v2_SD | Cut2v3_N | Cut2v3_M | Cut2v3_SD | Cut3v4_N | Cut3v4_M | Cut3v4_SD |
|---|---|---|---|---|---|---|---|---|---|
| 3 | 13146 | 21.5 | 2.58 | 13928 | 21.3 | 2.75 | 11815 | 21.6 | 3.10 |
| 4 | 12280 | 23.2 | 3.02 | 13422 | 23.1 | 3.11 | 12929 | 23.1 | 3.07 |
| 5 | 12303 | 21.7 | 2.66 | 12805 | 22.3 | 3.12 | 11726 | 24.2 | 3.04 |
| 6 | 12939 | 23.3 | 2.62 | 12719 | 24.0 | 3.54 | 9232 | 25.3 | 3.89 |
| 7 | 11897 | 25.5 | 2.85 | 13422 | 25.3 | 3.16 | 8373 | 26.7 | 3.15 |
| 8 | 5079 | 27.9 | 2.91 | 5922 | 28.0 | 2.69 | 3936 | 29.6 | 2.50 |
| HS | 396 | 31.4 | 1.75 | 612 | 30.6 | 1.69 | 722 | 31.2 | 1.93 |
| Grade | Cut1v2_N | Cut1v2_M | Cut1v2_SD | Cut2v3_N | Cut2v3_M | Cut2v3_SD | Cut3v4_N | Cut3v4_M | Cut3v4_SD |
|---|---|---|---|---|---|---|---|---|---|
| 3 | 13903 | 16.8 | 1.95 | 15496 | 16.0 | 1.47 | 12099 | 15.8 | 1.32 |
| 4 | 13714 | 17.2 | 2.24 | 15519 | 16.1 | 1.32 | 11850 | 15.2 | 1.81 |
| 5 | 12653 | 21.1 | 2.71 | 13918 | 17.1 | 2.57 | 11576 | 16.0 | 2.34 |
| 6 | 12416 | 22.2 | 2.59 | 12726 | 19.8 | 1.90 | 9958 | 18.0 | 2.64 |
| 7 | 11913 | 24.6 | 4.10 | 11431 | 20.7 | 3.17 | 9338 | 17.9 | 2.67 |
| 8 | 5048 | 30.7 | 4.25 | 5212 | 26.3 | 3.44 | 3876 | 23.0 | 3.16 |
| HS | 641 | 30.1 | 1.76 | 670 | 26.3 | 2.24 | 376 | 23.0 | 2.01 |
Figure 2.2 to Figure 2.15 are scatter plots of a random sample of 2,000 individual student SEMs as a function of scale score for the total test and claims/subscores by grade within subject. These plots show the variability of SEMs among students with the same scale score as well as the trend in SEM with student achievement (scale score). In comparison to the total score, a claim score has greater measurement error and variability among students due to the fact that the claim score is based on a smaller number of items. Among claims, those representing fewer items will have higher measurement error and greater variability of measurement error than those representing more items.
Dashed vertical lines in Figure 2.2 to Figure 2.15 represent the achievement level cut scores. The plots for the high school standard errors show cut scores for each grade 9, 10, and 11, separately.
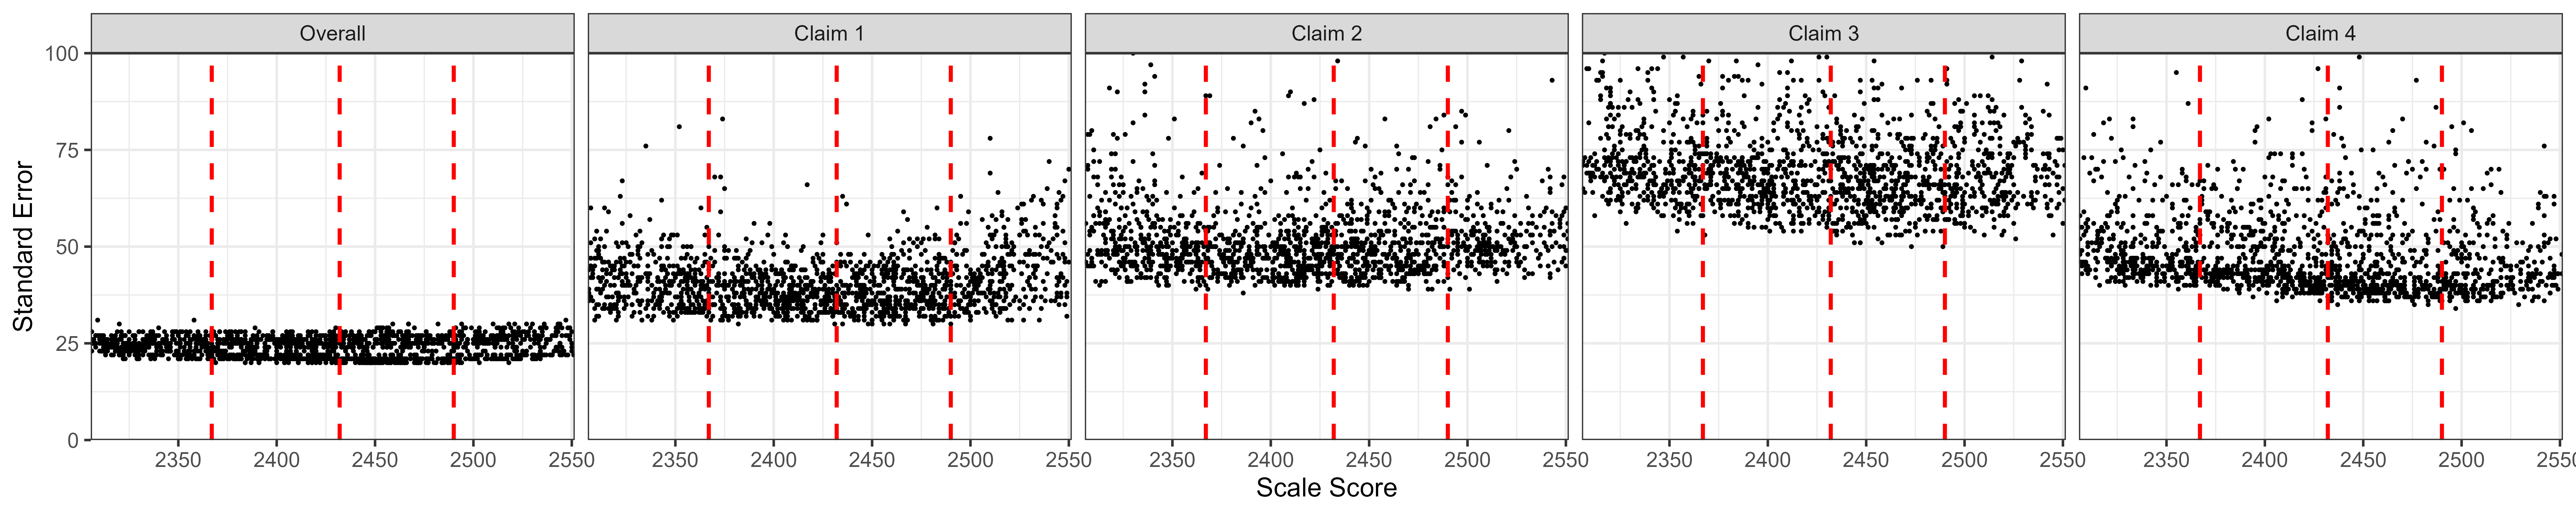
Figure 2.2: Students’ Standard Error of Measurement by Scale Score, ELA/Literacy Grade 3
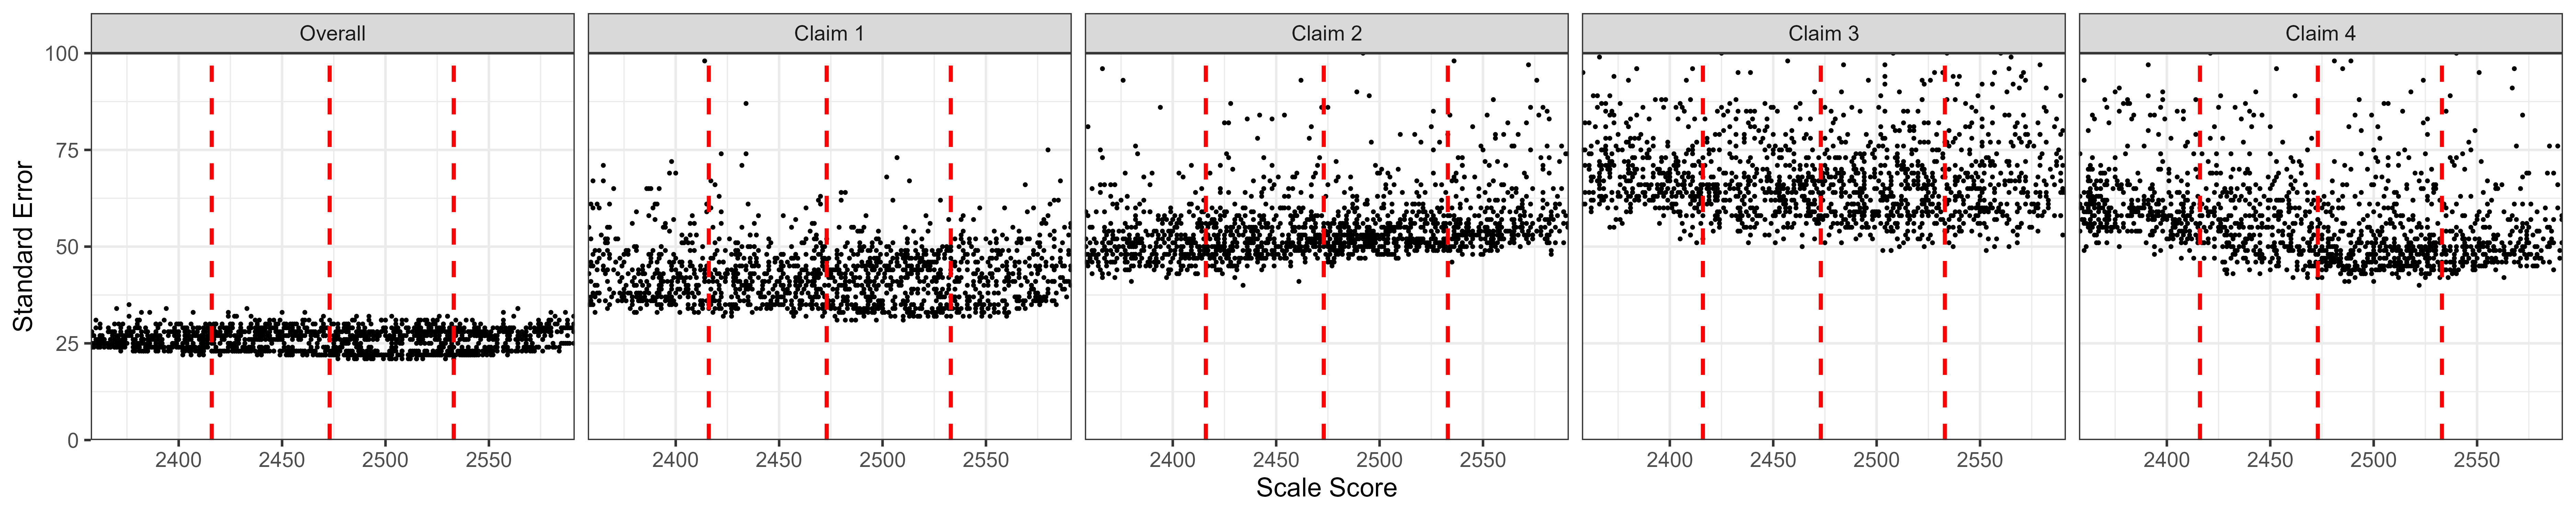
Figure 2.3: Students’ Standard Error of Measurement by Scale Score, ELA/Literacy Grade 4
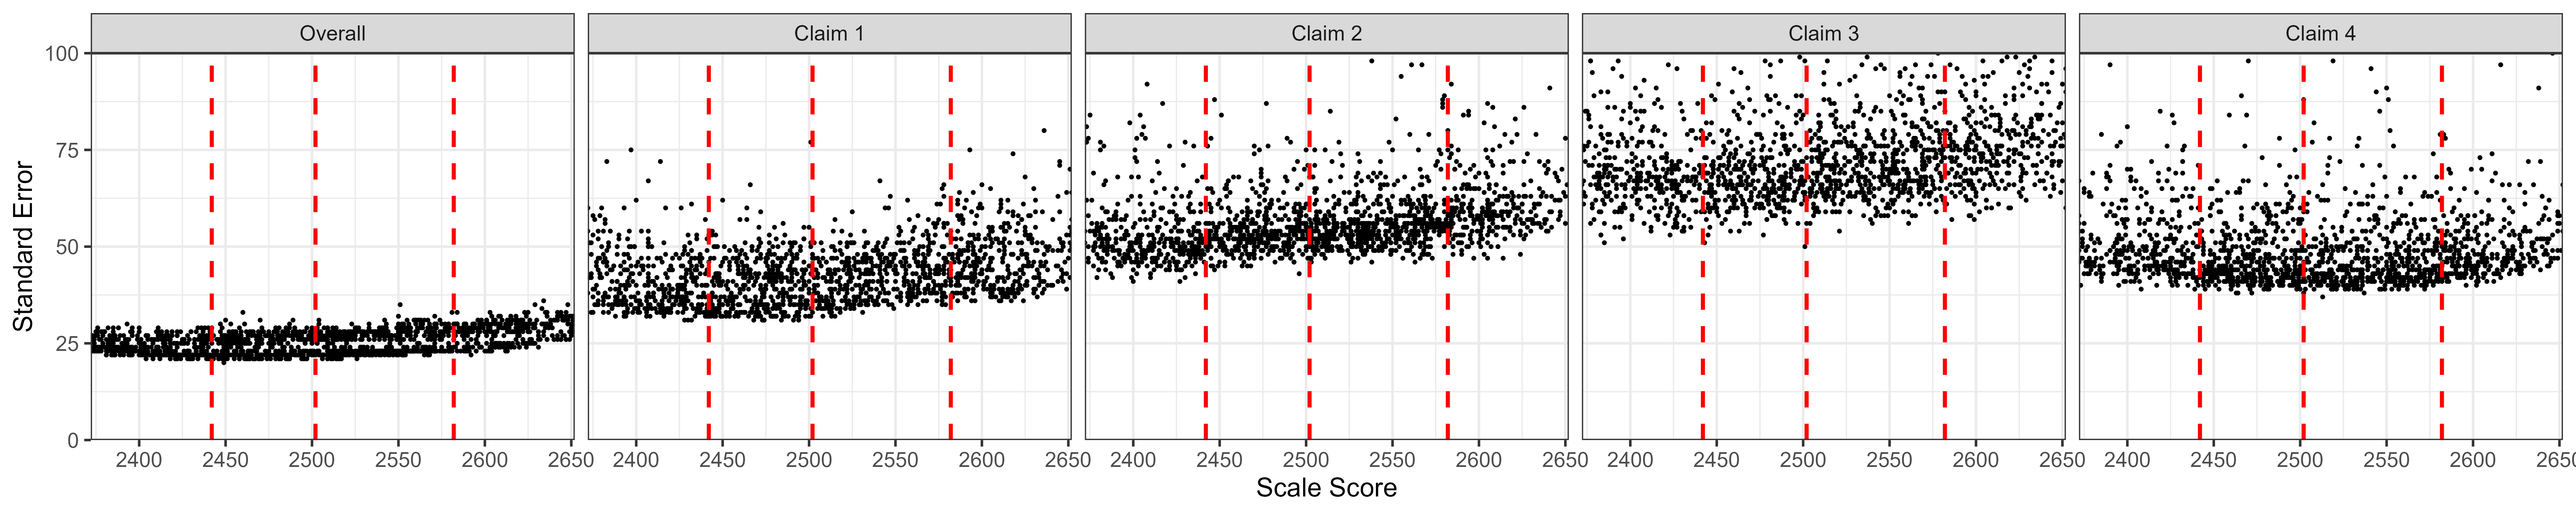
Figure 2.4: Students’ Standard Error of Measurement by Scale Score, ELA/Literacy Grade 5
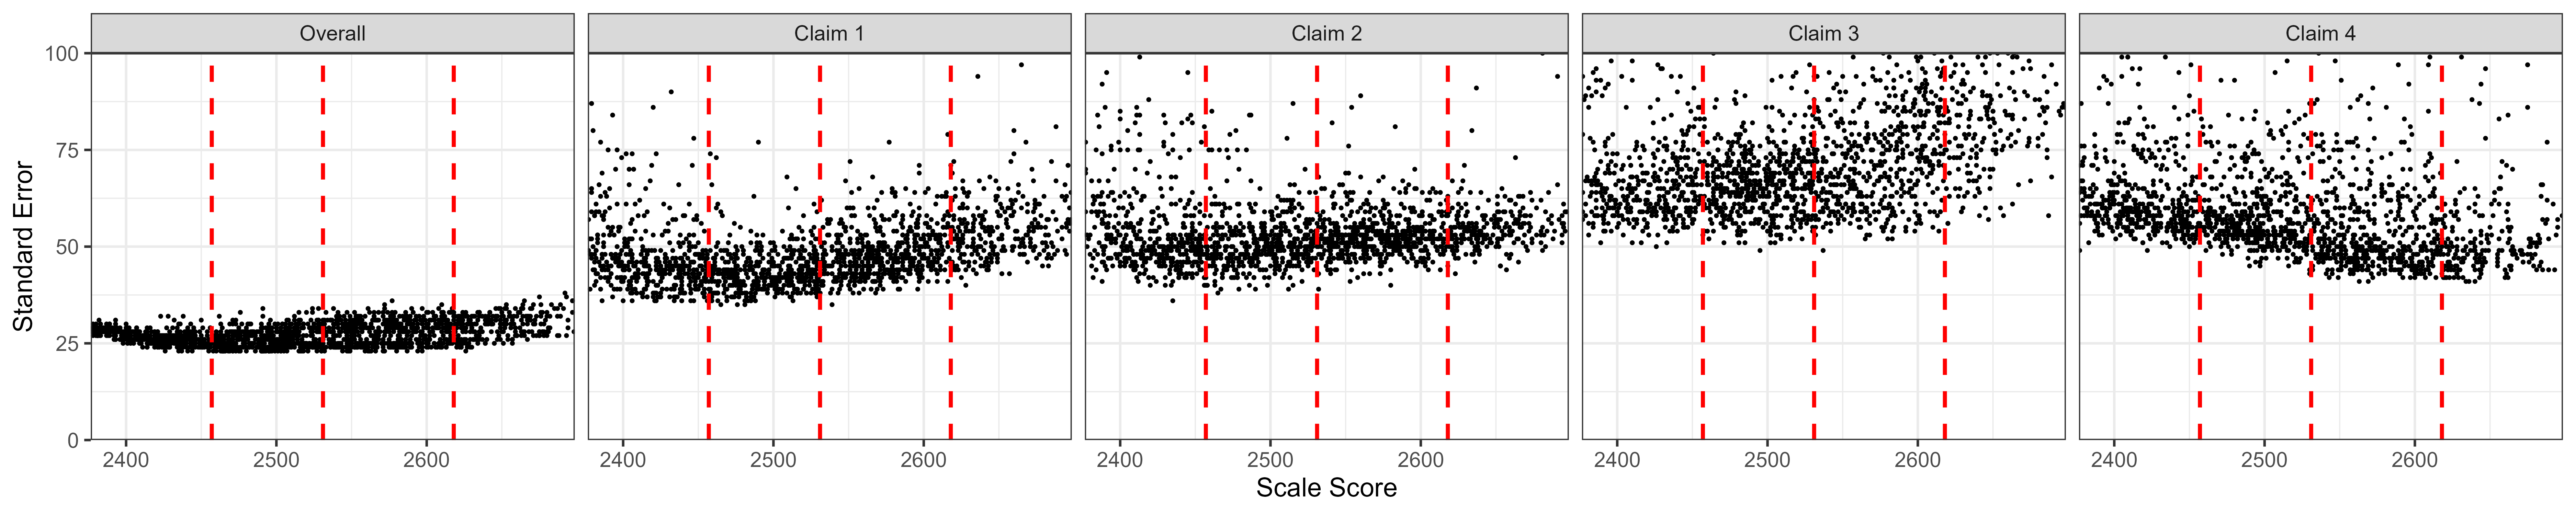
Figure 2.5: Students’ Standard Error of Measurement by Scale Score, ELA/Literacy Grade 6
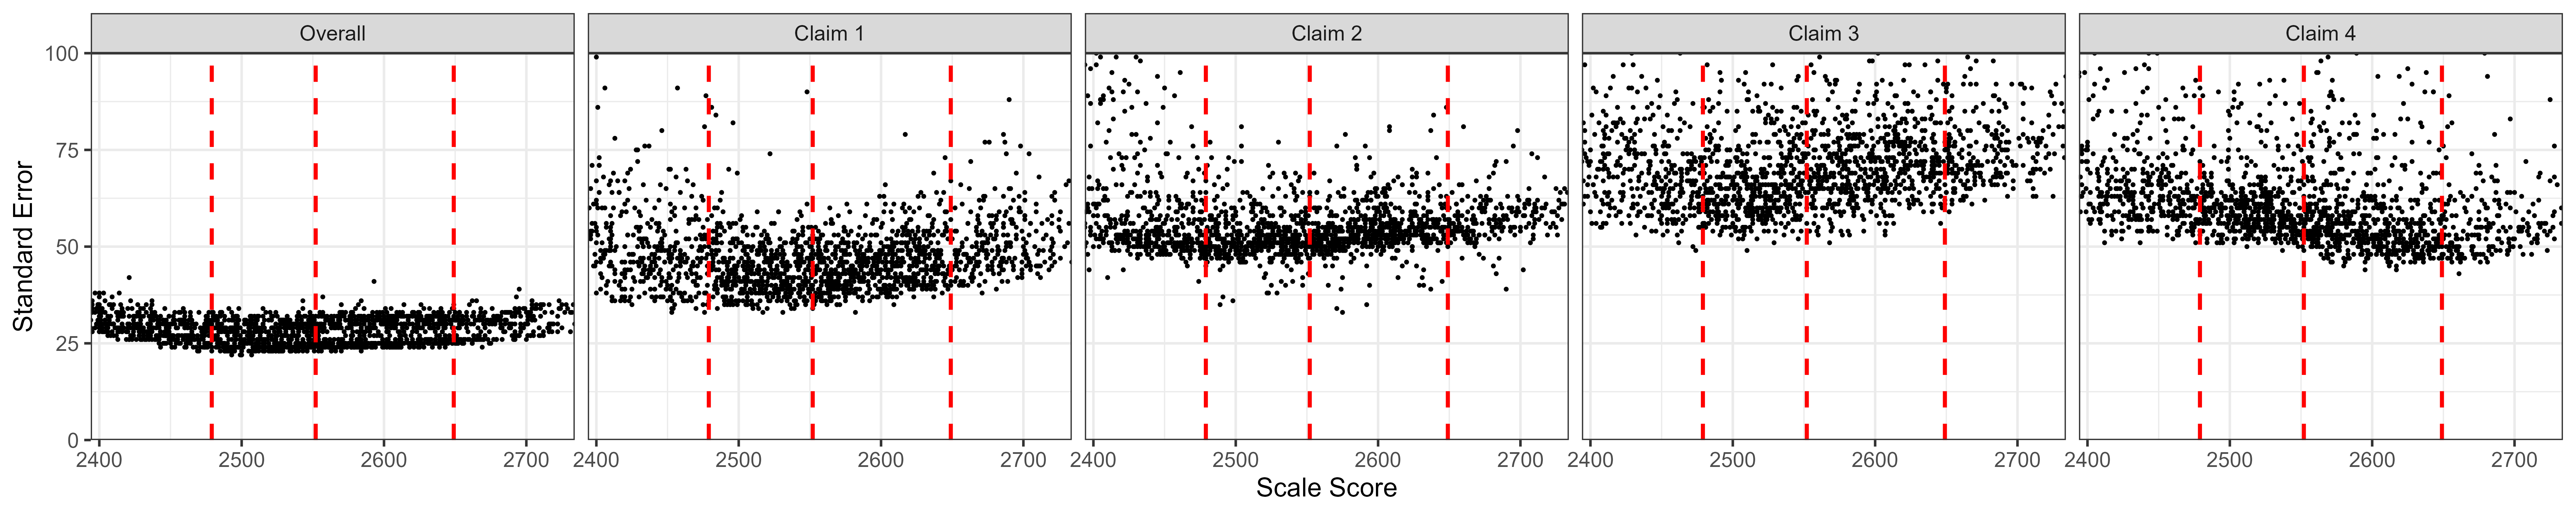
Figure 2.6: Students’ Standard Error of Measurement by Scale Score, ELA/Literacy Grade 7
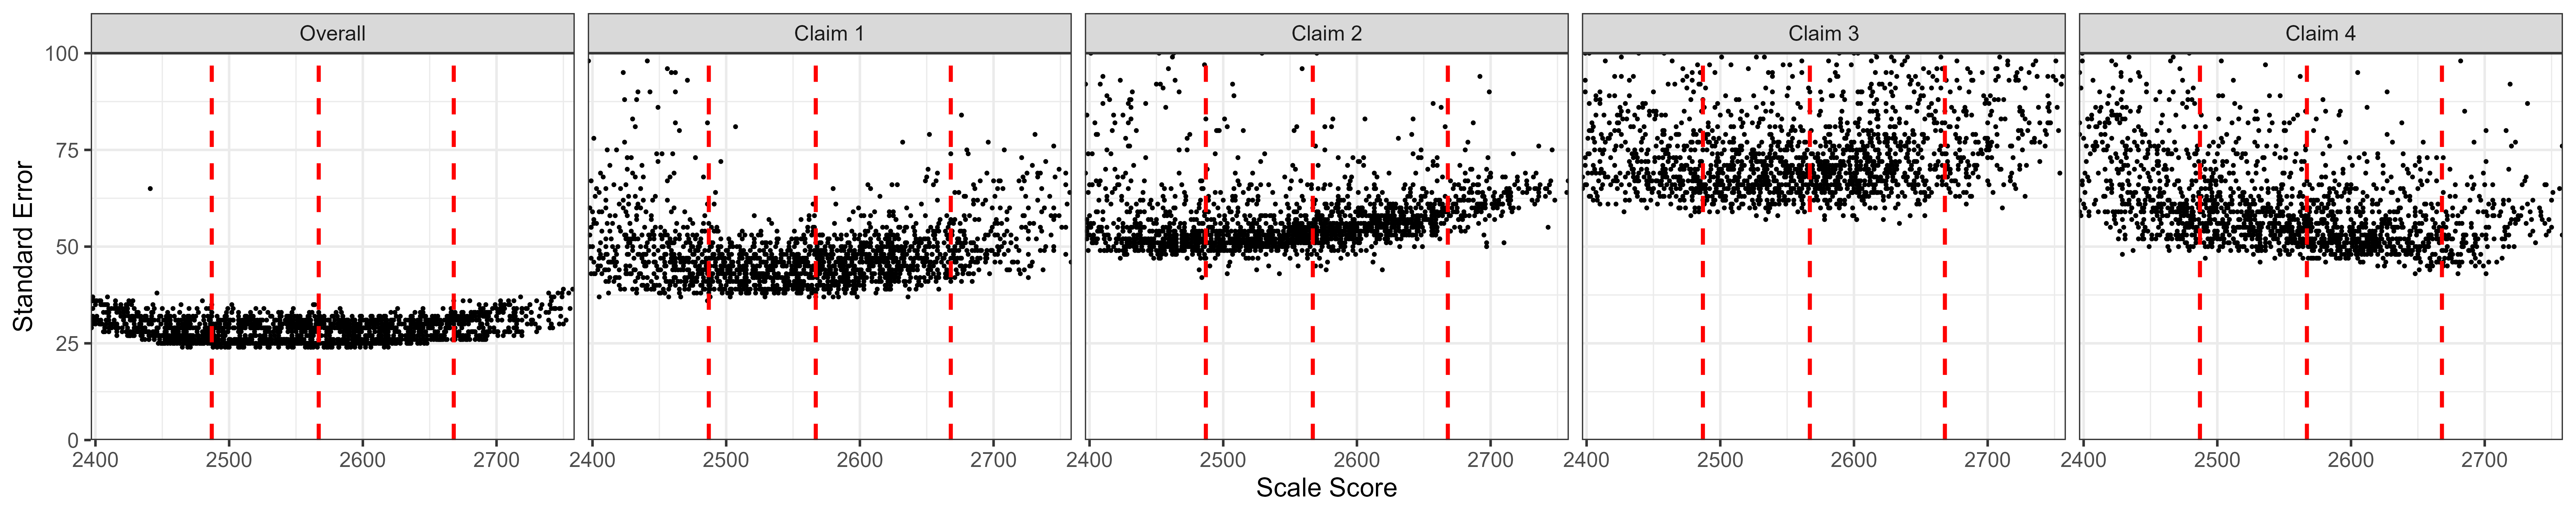
Figure 2.7: Students’ Standard Error of Measurement by Scale Score, ELA/Literacy Grade 8
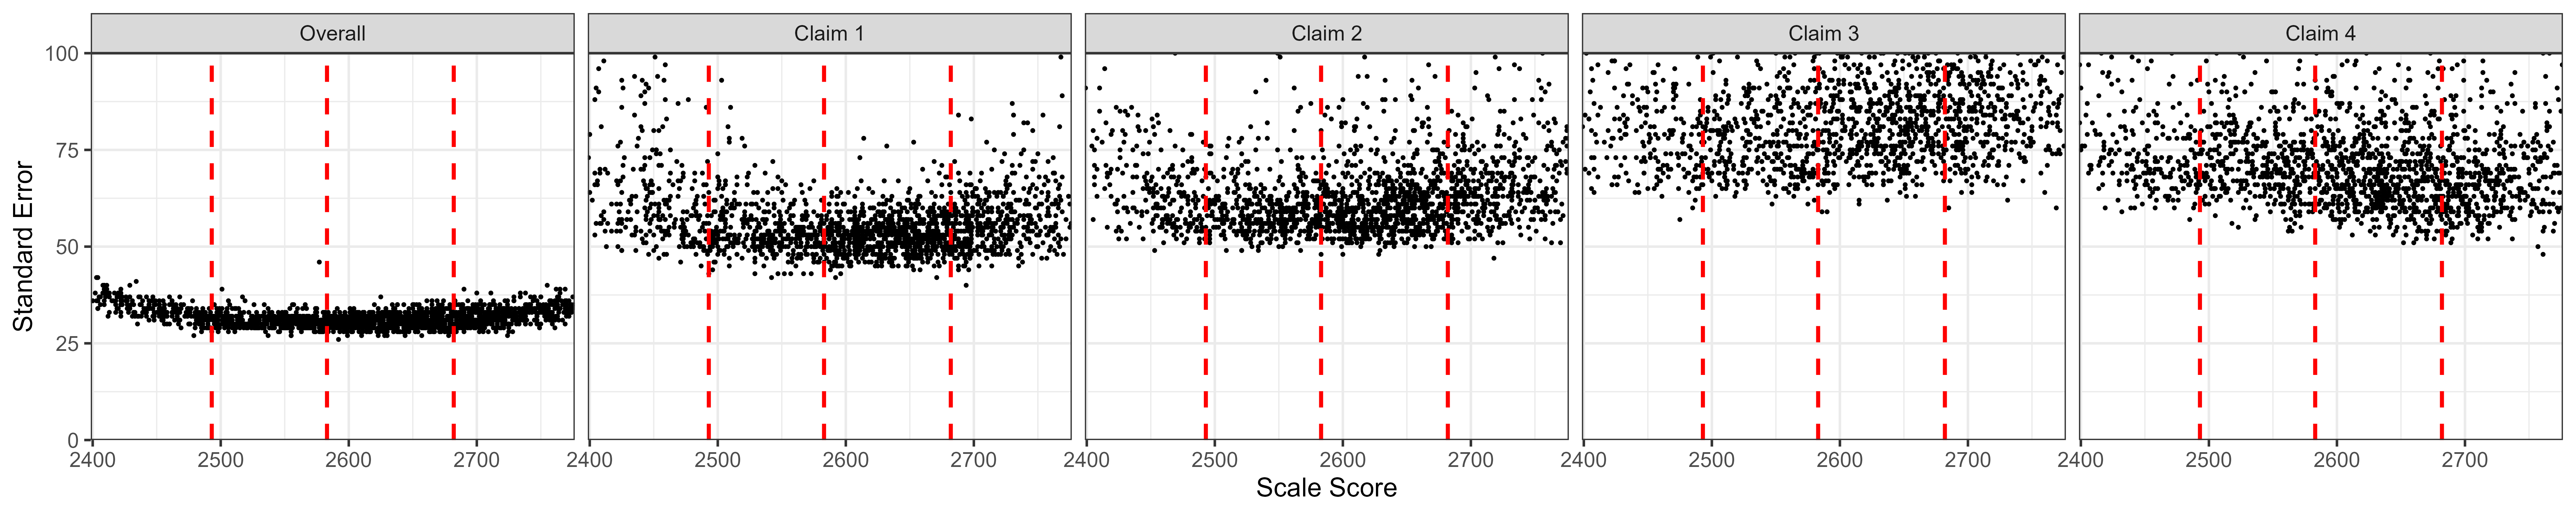
Figure 2.8: Students’ Standard Error of Measurement by Scale Score, ELA/Literacy High School
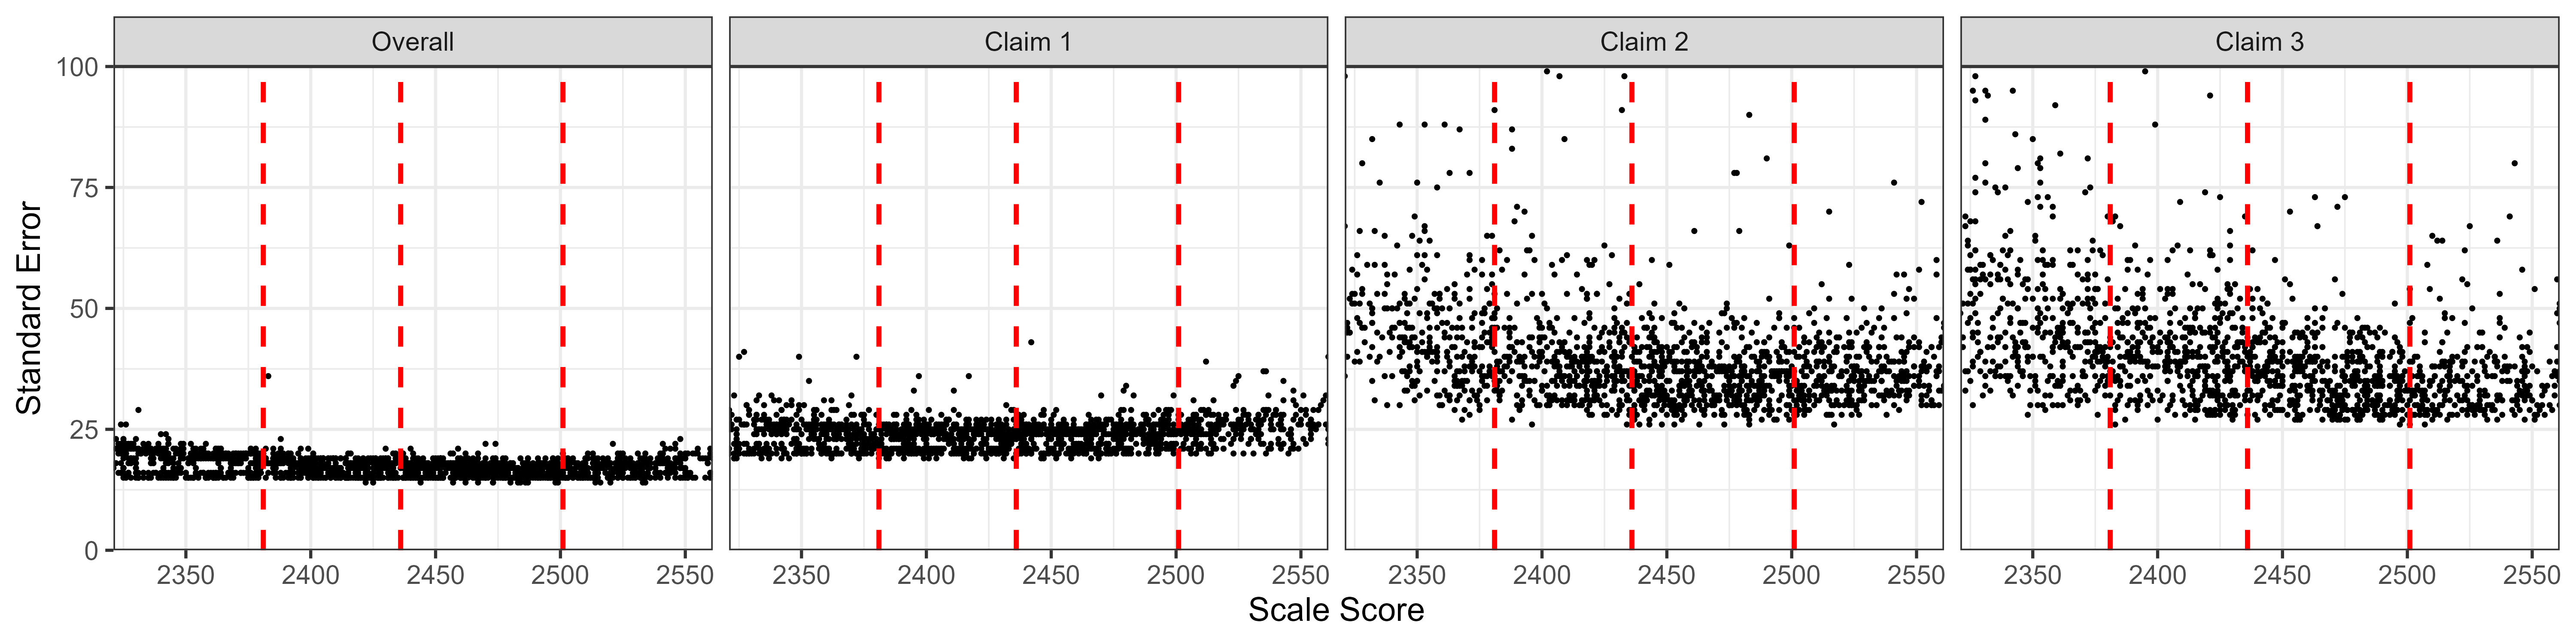
Figure 2.9: Students’ Standard Error of Measurement by Scale Score, Mathematics Grade 3
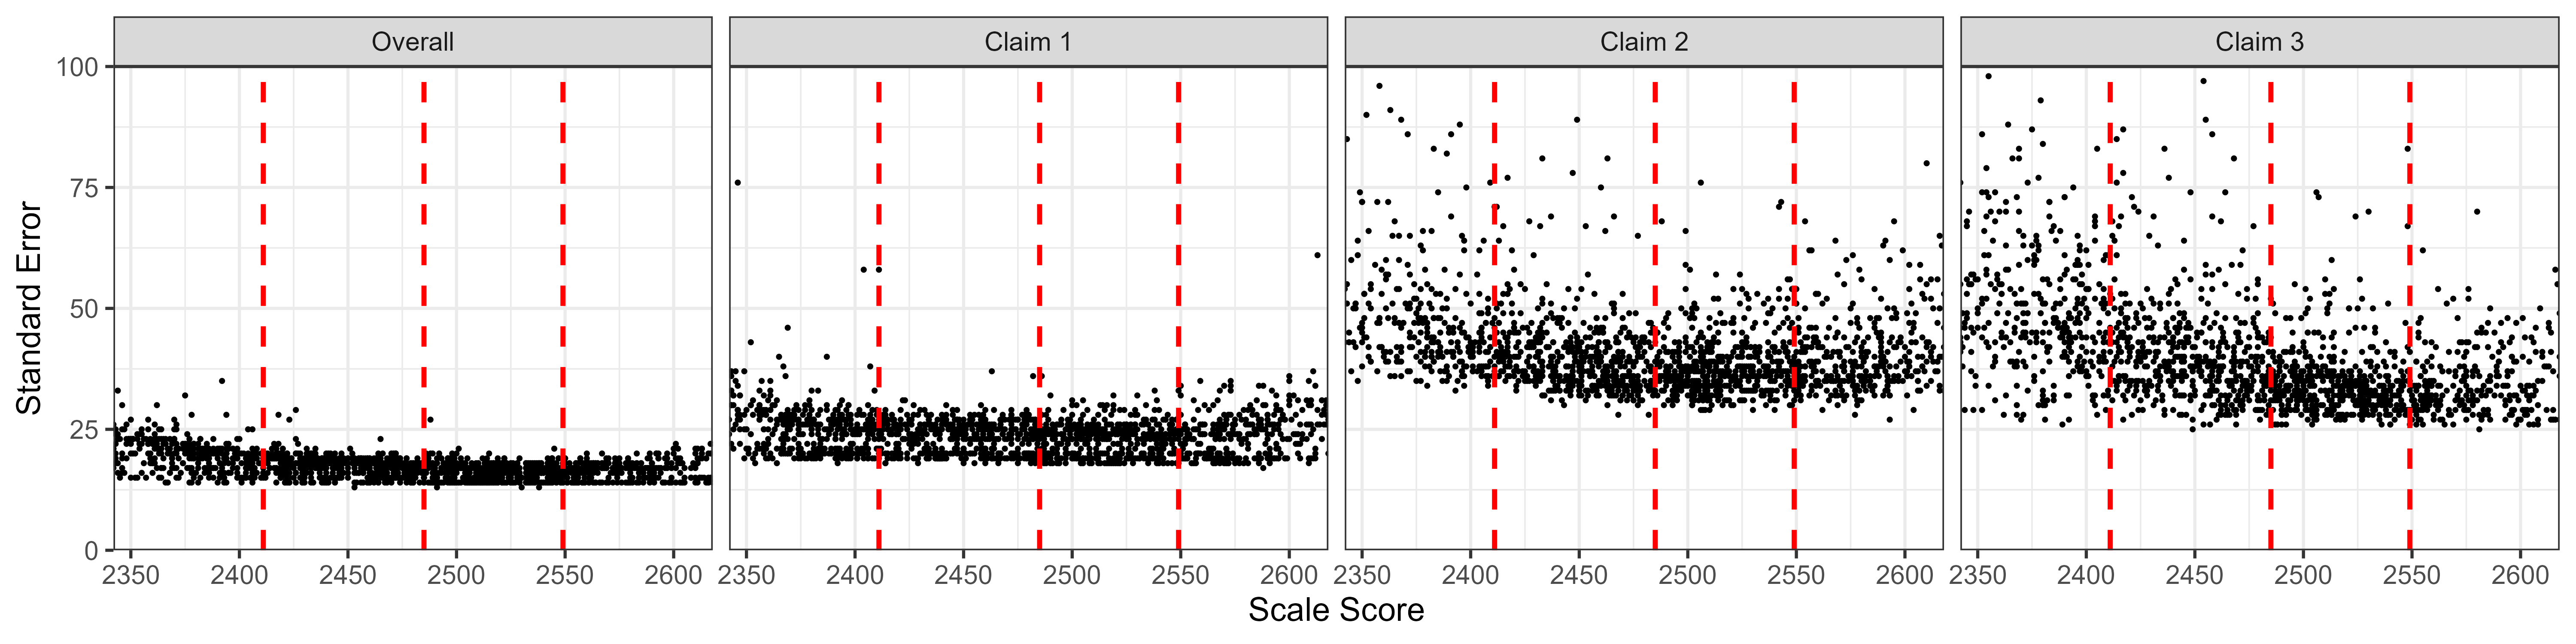
Figure 2.10: Students’ Standard Error of Measurement by Scale Score, Mathematics Grade 4
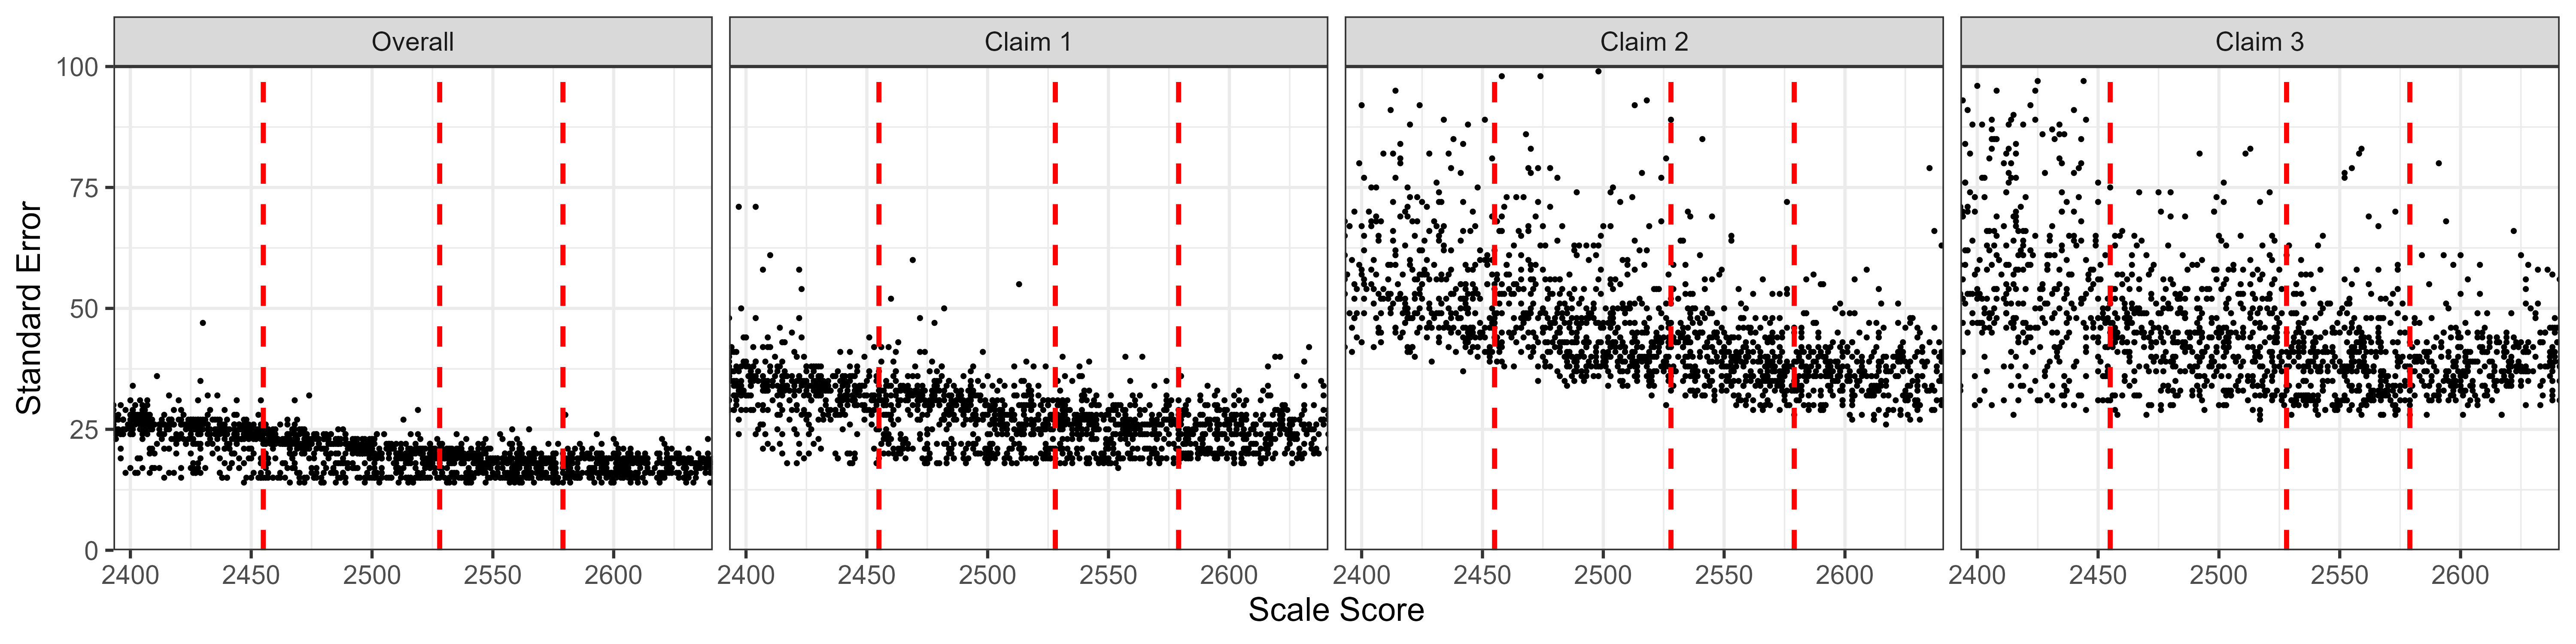
Figure 2.11: Students’ Standard Error of Measurement by Scale Score, Mathematics Grade 5
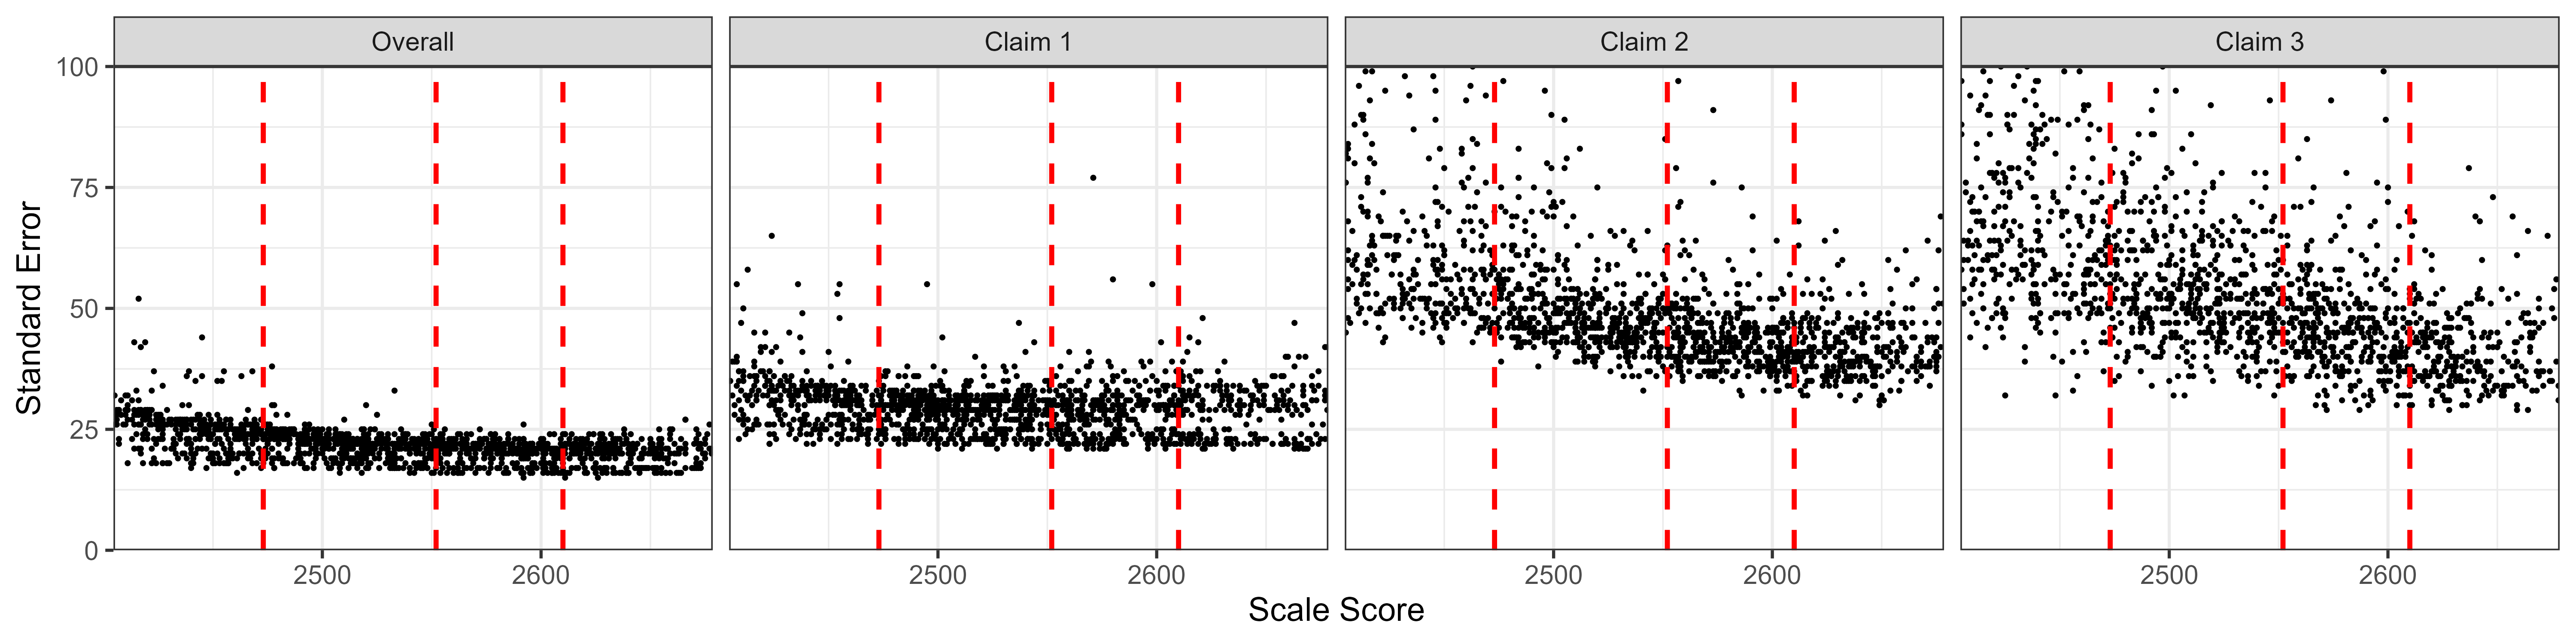
Figure 2.12: Students’ Standard Error of Measurement by Scale Score, Mathematics Grade 6
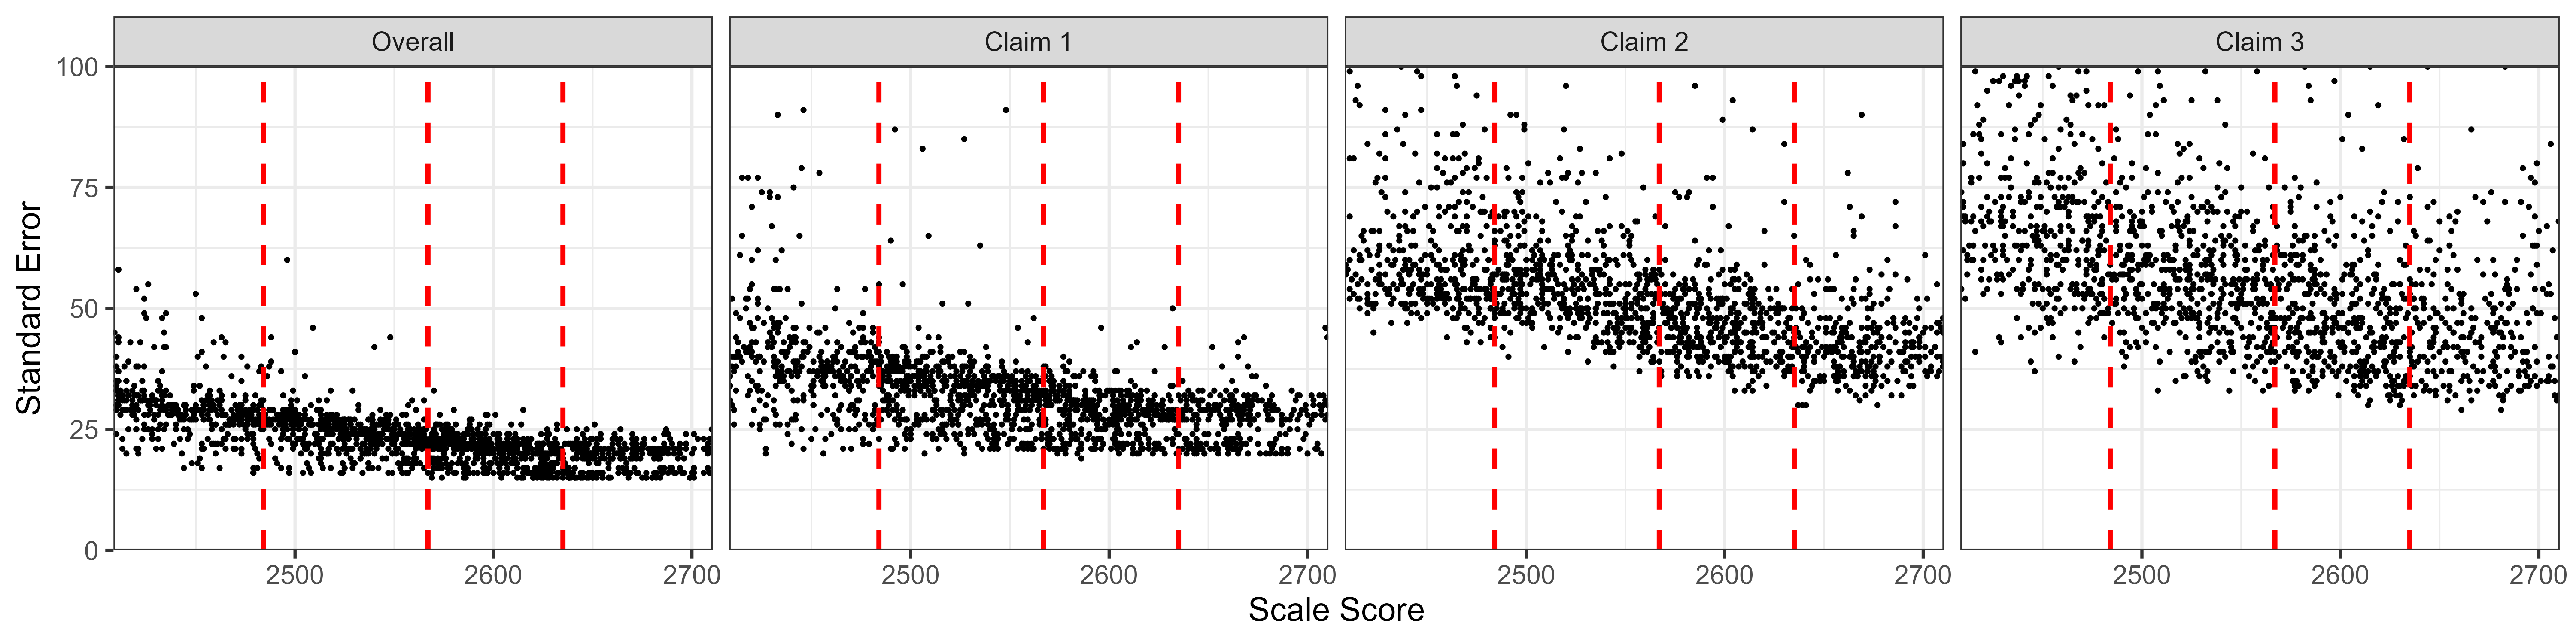
Figure 2.13: Students’ Standard Error of Measurement by Scale Score, Mathematics Grade 7
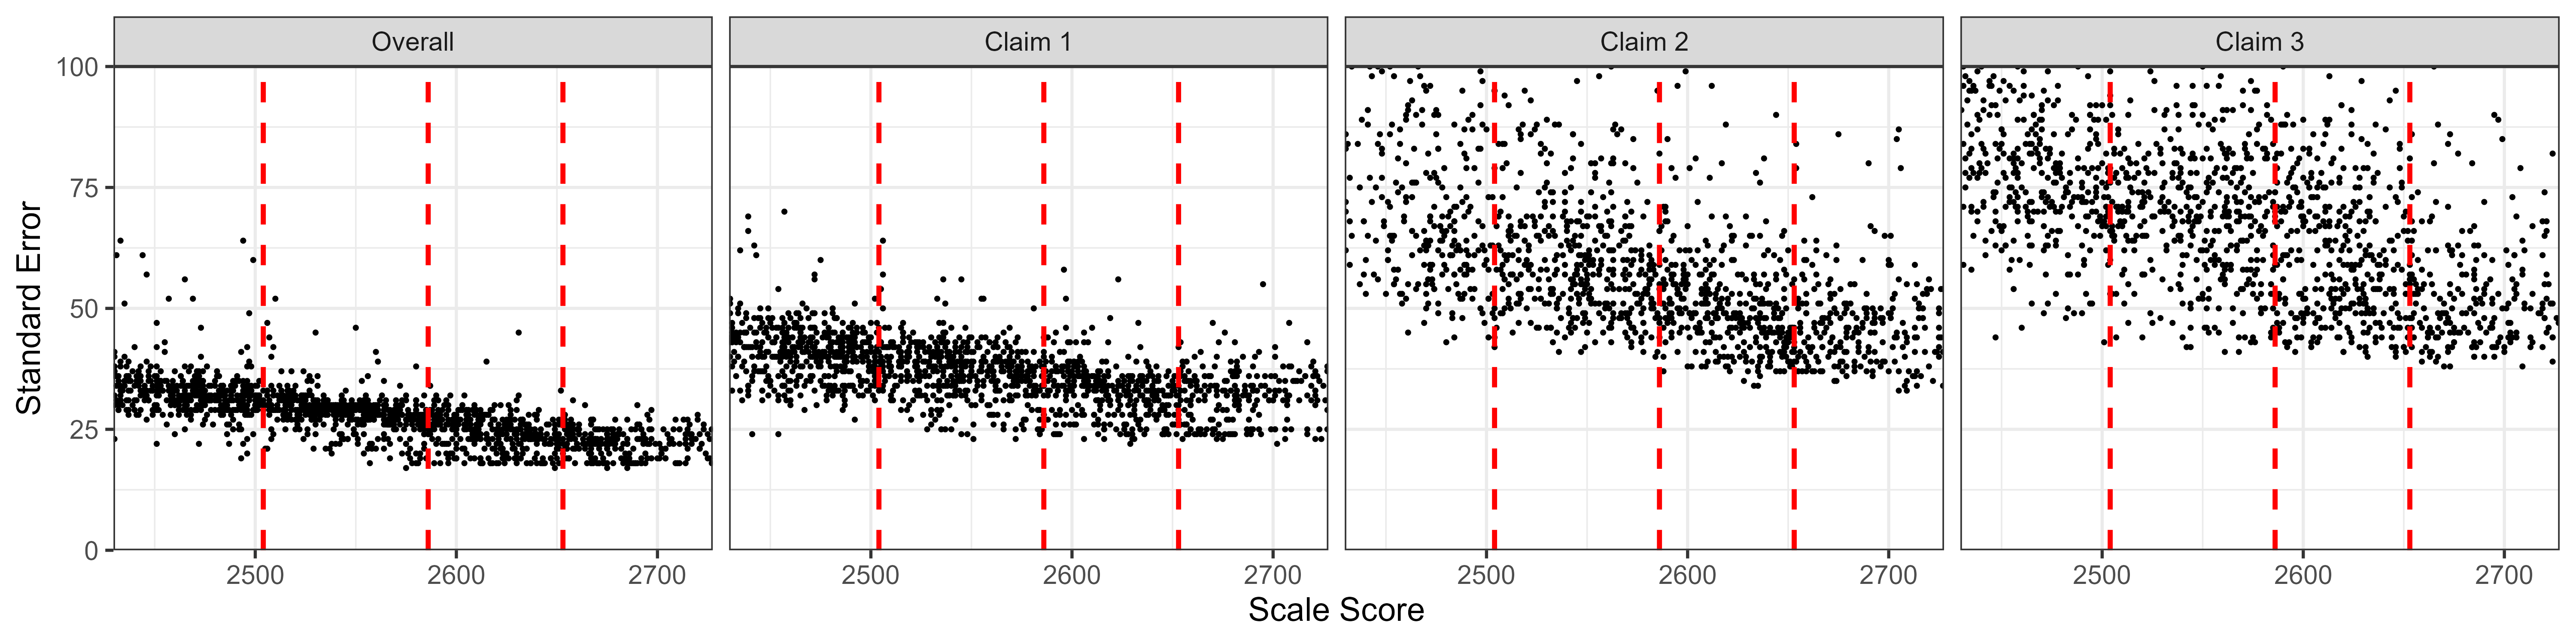
Figure 2.14: Students’ Standard Error of Measurement by Scale Score, Mathematics Grade 8
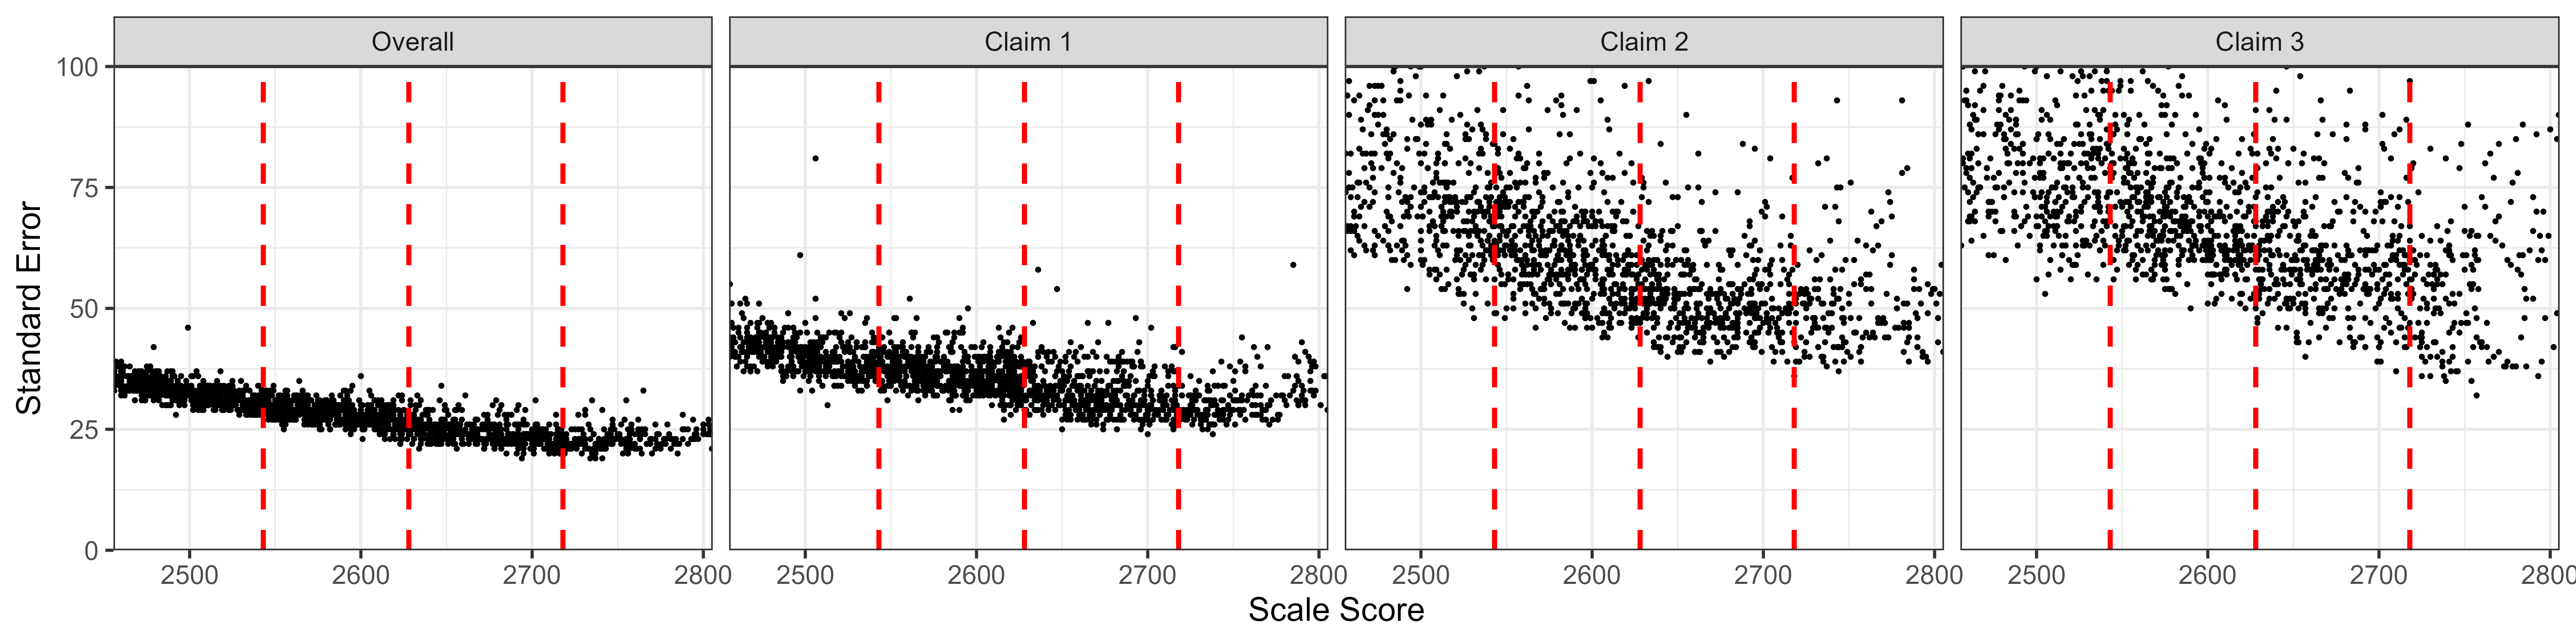
Figure 2.15: Students’ Standard Error of Measurement by Scale Score, Mathematics High School
All of the tables and figures in this section, for every grade and subject, show a trend of higher measurement error for lower-achieving students. This trend reflects the fact that the item pool is difficult in comparison to overall student achievement. The computer adaptive test (CAT) algorithm still delivers easier items to lower-achieving students than they would typically receive in a non-adaptive test, or in a fixed form where difficulty is similar to that of the item pool as a whole. But low-achieving students still tend to receive items that are relatively more difficult for them. Typically, this is because the CAT algorithm does not have easier items available within the blueprint constraints that must be met for all students.