Chapter 6 Reporting and Interpretation
6.1 Introduction
This chapter provides an overview of the Smarter Balanced open-source reporting system. The use of the Smarter Balanced reporting system is optional and configurable. Members can use the open-source system to develop and customize reports for their own use. Information about a specific member’s reports should be gathered from member websites and materials.
It should be noted that the hand scoring of student answers to constructed-response items in interim assessments is a state vendor task and is not subject to the rigorous controls used in the summative assessment. Local results may show some variations from standardized hand-scoring results. Even when an interim is administered under standardized test administration, local hand scoring may not be standardized. Also, if an interim assessment is administered to students more than once, familiarity with test questions may affect student performance and the accuracy of results as related to past and future performance. For these reasons and the fact that teachers may view the items and student responses, the interims are not intended to be used for accountability purposes.
6.2 Types of Scores
As noted in Chapter 4 on test design, the ICAs provide an overall indicator of proficiency and a set of claim indicators corresponding to more specific areas of content (claims) within the broader content areas (ELA/literacy and mathematics). Information from IABs is reported in the same manner as claim-level information on the ICAs and summative assessments. Specifically, student performance on IABs and on ICA claim-level content is reported as “above,” “near,” or “below” standard, where the standard is the level 3 cut score. A student’s overall performance on an ICA is reported as described in the following section.
6.2.1 Overall Test Scores
Scale scores are the basic means of reporting a student’s overall performance on summative and ICA tests. These scores fall along a continuous vertical scale that increases across grade levels from approximately 2000 to 3000. Scores are used to describe an individual student’s current level of achievement. They can also be used to track growth over time (Martineau, 2016a,b). The achievement of groups of students differentiated by administration year, district, school, classroom, or demographics is described by the group mean and standard deviation, the percent of students at each achievement level, and the percent of students at or above proficient, where the level 3 cut score is the lower boundary of proficient.
For the ICA, the Smarter Balanced reporting system communicates an individual student’s overall scale score in relation to achievement levels using graphics similar to Figure 6.1. By default, the system uses generic terms for the achievement levels (level 1, level 2, level 3, and level 4), but members may customize them using terms such as “novice, developing, proficient, advanced” or others.
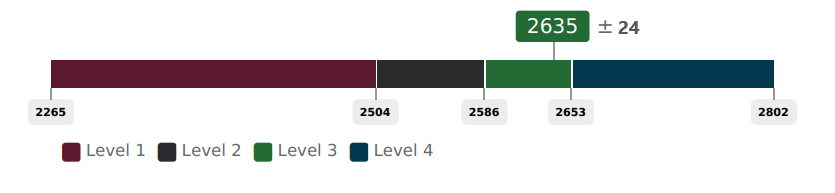
Figure 6.1: Portrayal of Score Reporting Levels and Error Band
The achievement levels in Figure 6.1 and in Smarter Balanced reports are illustrated by colored bands that collectively extend from the lowest obtainable scale score (LOSS) to the highest obtainable scale score (HOSS). The LOSS (2265), HOSS (2802), and cut scores separating the achievement levels in Figure 6.1 are those for grade 8 mathematics.
ICA scale scores are reported with an error band based on the standard error of measurement (SEM) (see Chapter 2). In Figure 6.1, the overall score is 2635, which is in level 3. However, it should be noted that the score’s error band encompasses level 4. Smarter Balanced reporting provides information to help users understand the meaning of the error bands.
Smarter Balanced has developed a set of customizable achievement level descriptors for ELA/literacy and mathematics that are aligned with the Common Core State Standards (CCSS) and Smarter Balanced assessment claims. The intent of these descriptors is to specify, in content terms, the knowledge and skills that students may display at four levels of achievement. The full set of customizable reporting achievement level descriptors are available to the public online (Smarter Balanced, 2017d, 2019f,g).
6.2.2 IAB Overall Scores and ICA Content-Area (Claim) Scores
Student performance on IABs and on content areas (claims) of the ICAs are reported in terms of scale scores and their standard errors. In addition, student performances is classified into one of three reporting categories: “above,” “near,” or “below” standard. The standard is the level 3 cut score (the lower boundary of level 3 achievement level). Table 6.1 and Table 6.2 show the claims for which ICA (and summative) claim scores are reported in the subject areas of ELA/literacy and mathematics. Not showing in Table 6.2 is the fact that in mathematics, claims 2 and 4 are combined to produce a single subscore. In all other cases, a subscore corresponds to one and only one claim.
| Claim | Description |
|---|---|
| 1: Reading | Students can read closely and analytically to comprehend a range of increasingly complex literary and informational texts. |
| 2: Writing | Students can produce effective and well-grounded writing for a range of purposes and audiences. |
| 3: Speaking and Listening | Students can employ effective speaking and listening skills for a range of purposes and audiences. At this time, only listening is assessed. |
| 4: Research | Students can engage in research/inquiry to investigate topics and to analyze, integrate, and present information. |
| Claim | Description |
|---|---|
| 1: Concepts and Procedures | Students can explain and apply mathematical concepts and interpret and carry out mathematical procedures with precision and fluency. |
| 2: Problem-Solving | Students can solve a range of complex, well-posed problems in pure and applied mathematics, making productive use of knowledge and problem-solving strategies. |
| 3: Communicating Reasoning | Students can clearly and precisely construct viable arguments to support their own reasoning and to critique the reasoning of others. |
| 4: Modeling and Data Analysis | Students can analyze complex, real-world scenarios and can construct and use mathematical models to interpret and solve problems. |
Other than the level 3 cut score serving as the standard for the reporting categories (“above,” “below,” or “near” standard), achievement levels per se are not used in reporting ICA claim scores and IAB overall scores.
The measurement error associated with ICA claim scores and IAB overall scores is used to classify the student’s performance into the reporting categories. To classify a student’s performance into one of the three reporting categories, an error band is defined that extends 1.5 times the SEM of the student’s subscore above and below the student’s subscore. The subscore is located on the same reporting scale that is used to report the summative and ICA overall scores. Table 6.3 shows how the student’s performance is then classified based on where the standard—the level 3 cut score—sits with respect to this error band.
| Category | Description |
|---|---|
| Above Standard | The Level 3 cut score is below the error band |
| Near Standard | The Level 3 cut score falls on or within the boundaries of the error band |
| Below Standard | The Level 3 cut score is below the error band |
Although IAB overall scores and ICA claim scores are portrayed in Smarter Balanced reports using the three reporting categories, claim-level scale scores and SEMs are available to members in the data provided from their vendors. Members may use these in local reporting systems.
Reporting for IABs is focused on communicating the block-level results for a list of students by assessment grade and for individual student reporting. Like the ICA, IAB results are not aggregated. As some interim items are locally scored, educators will see individual student responses to hand-scored items through the scoring component. A single Individual student report is provided for all the interim block assessments that a student has taken in a given academic year.
Educators, students, parents, and guardians may use the individual student reports as one indicator to understand a student’s achievement, progress toward mastery of the Common Core State Standards, and attainment of the academic knowledge and skills required to be college and career ready. The report may provide context for a parent-teacher conference or, together with other instructional data, may help to identify areas for instructional focus.
ICA claim scores are reported as shown in Figure 6.2 below.
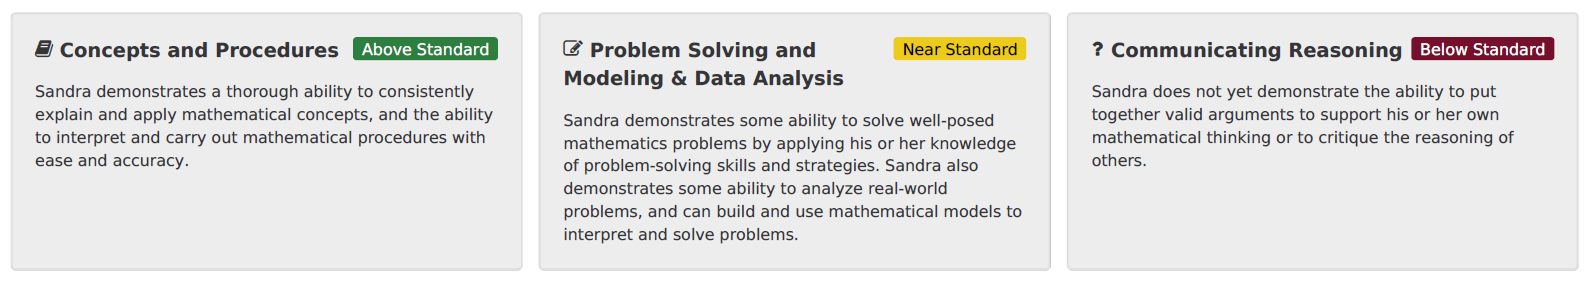
Figure 6.2: Illustration of ICA Claim-Score Reporting on Individual Student Reports
6.3 Types of Reports
The Smarter Balanced reporting system is an interactive, online reporting platform that provides a range of interim reports. Educators can log into the system to create reports. They can use their own labels for achievement levels and their own student groups if desired.
6.3.1 Individual Student Reports
There is one type of report available for the interim assessments: individual student reports (ISRs). The ISR will be described briefly here, but the reader is urged to consult the Smarter Balanced Reporting System User Guide (Smarter Balanced, 2018g) for more detail. The ISRs present individual student assessment scores, SEMs, and achievement levels. They also display the reporting categories for claim-score results, as illustrated above. The scores and descriptions provide context for understanding what the assessment has measured and how to interpret the scores and subscores. The reports are designed for teachers, students, and parents to use in understanding a student’s achievement and progress toward mastery of the CCSS. The report may be part of a larger set of information that provides context for instructional focus. Individual student reports can be downloaded as PDF files for easy printing and distribution to parents.
6.3.2 Data Downloads
In addition to the predesigned reports, the Smarter Balanced open-source reporting system offers authorized users the ability to download data for distribution or further review and analysis in external systems. User authorization is closely controlled for ISRs and personally identifiable information (PII) in files. The list of available data downloads appears in Table 6.4. Note that these downloads assume that members have loaded data into the Smarter Balanced data warehouse. In practice, many members get this information directly from test delivery service providers and do not go through the data warehouse.
| Download Type | Description |
|---|---|
| Student Assessment Results Export | This is a download of the assessment results for the selected assessment, with one row per student. The resulting files contain all of the data for the overall scale score, error band, achievement level, and claim scores for ICA and summative, as well as all the student data (e.g., demographics, grade/school/district/state attribution, etc.) for the specific summative or interim assessment being viewed. |
| Printable Student Reports | Printable versions of the individual student report. |
| Custom Aggregate Report Export | This is a download of a customized aggregate report of assessment results for a selected assessment type (summative, IAB, ICA), with one row per student. The resulting files contain all of the data for the overall scale score, error band, achievement level, and claim scores for ICA and summative, as well as all the student data (e.g., demographics, grade/school/district/state attribution, etc.) for the selected assessment type. |
| District/School Export | This is a bulk download of all assessment results for the selected school/district, with one row per student. The resulting files contain all of the data for the overall scale score, error band, achievement level, and claim scores for ICA and summative, as well as all the student data (e.g., demographics, grade/school/district/state attribution, etc.) for all assessments administered to date in the district/school. |